Fig. 14.
Download original image
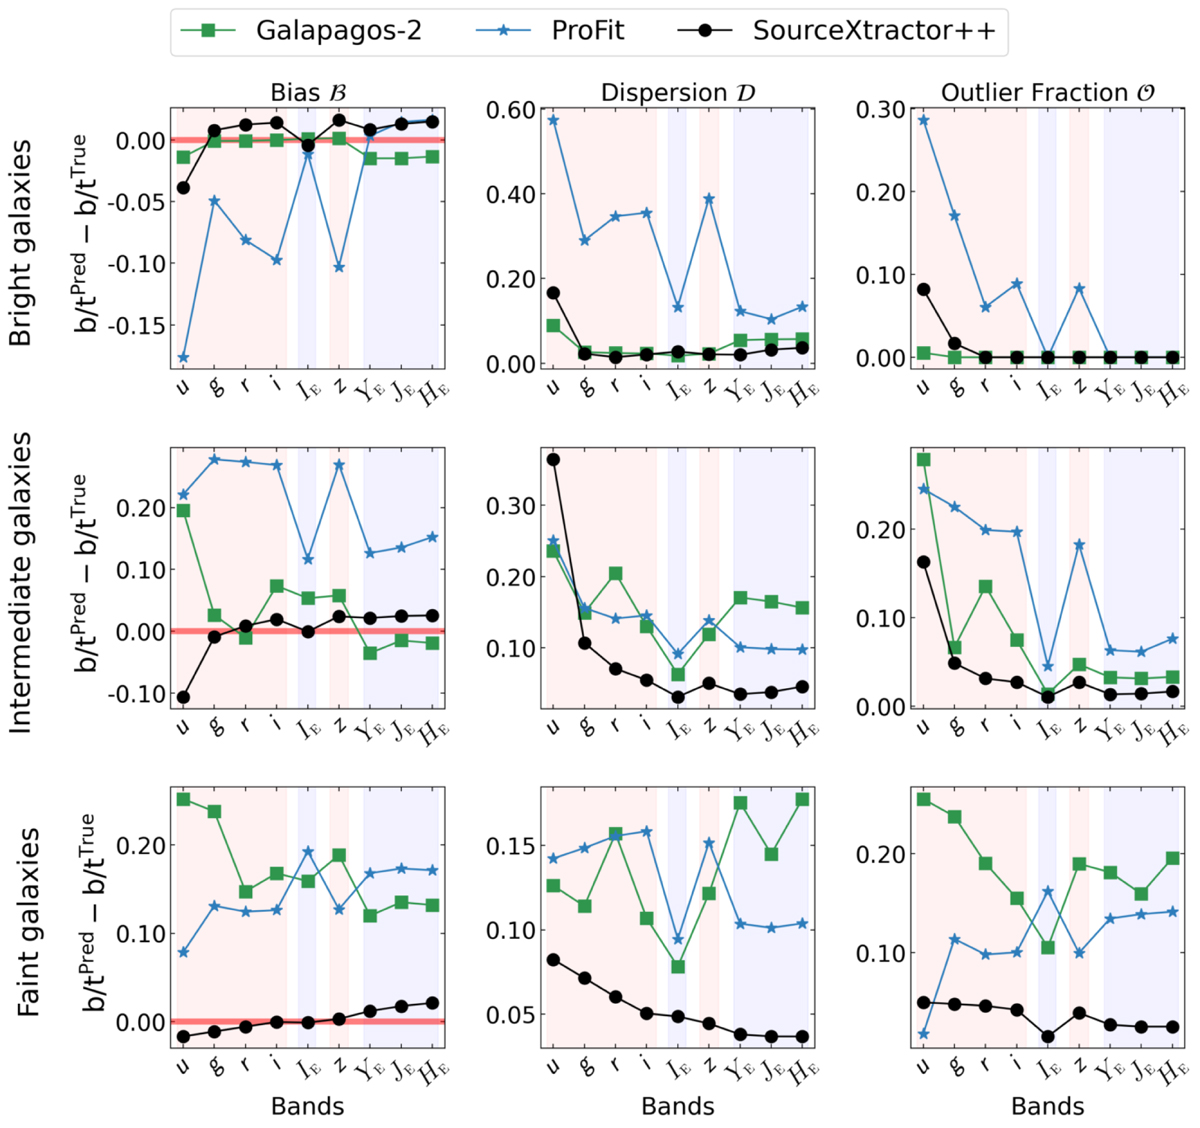
Results for the fitting of b/t in double-Sérsic multi-band data. The three lines represent the results for three different selections of galaxies. From top to bottom: bright galaxies (14 < IE < 20); intermediate galaxies (20 < IE < 23); and faint galaxies (23 < IE < 26). The three columns represents our three metrics, the bias ℬ, the dispersion 𝒟, and the outlier fraction 𝒪, which are plotted on the y-axis of the corresponding columns. The x-axis represents the different bands, ordered by increasing wavelength (IE overlaps with g, r, and i). The background colours show the Euclid bands in blue and the Rubin bands in red.
Current usage metrics show cumulative count of Article Views (full-text article views including HTML views, PDF and ePub downloads, according to the available data) and Abstracts Views on Vision4Press platform.
Data correspond to usage on the plateform after 2015. The current usage metrics is available 48-96 hours after online publication and is updated daily on week days.
Initial download of the metrics may take a while.