Fig. 1.
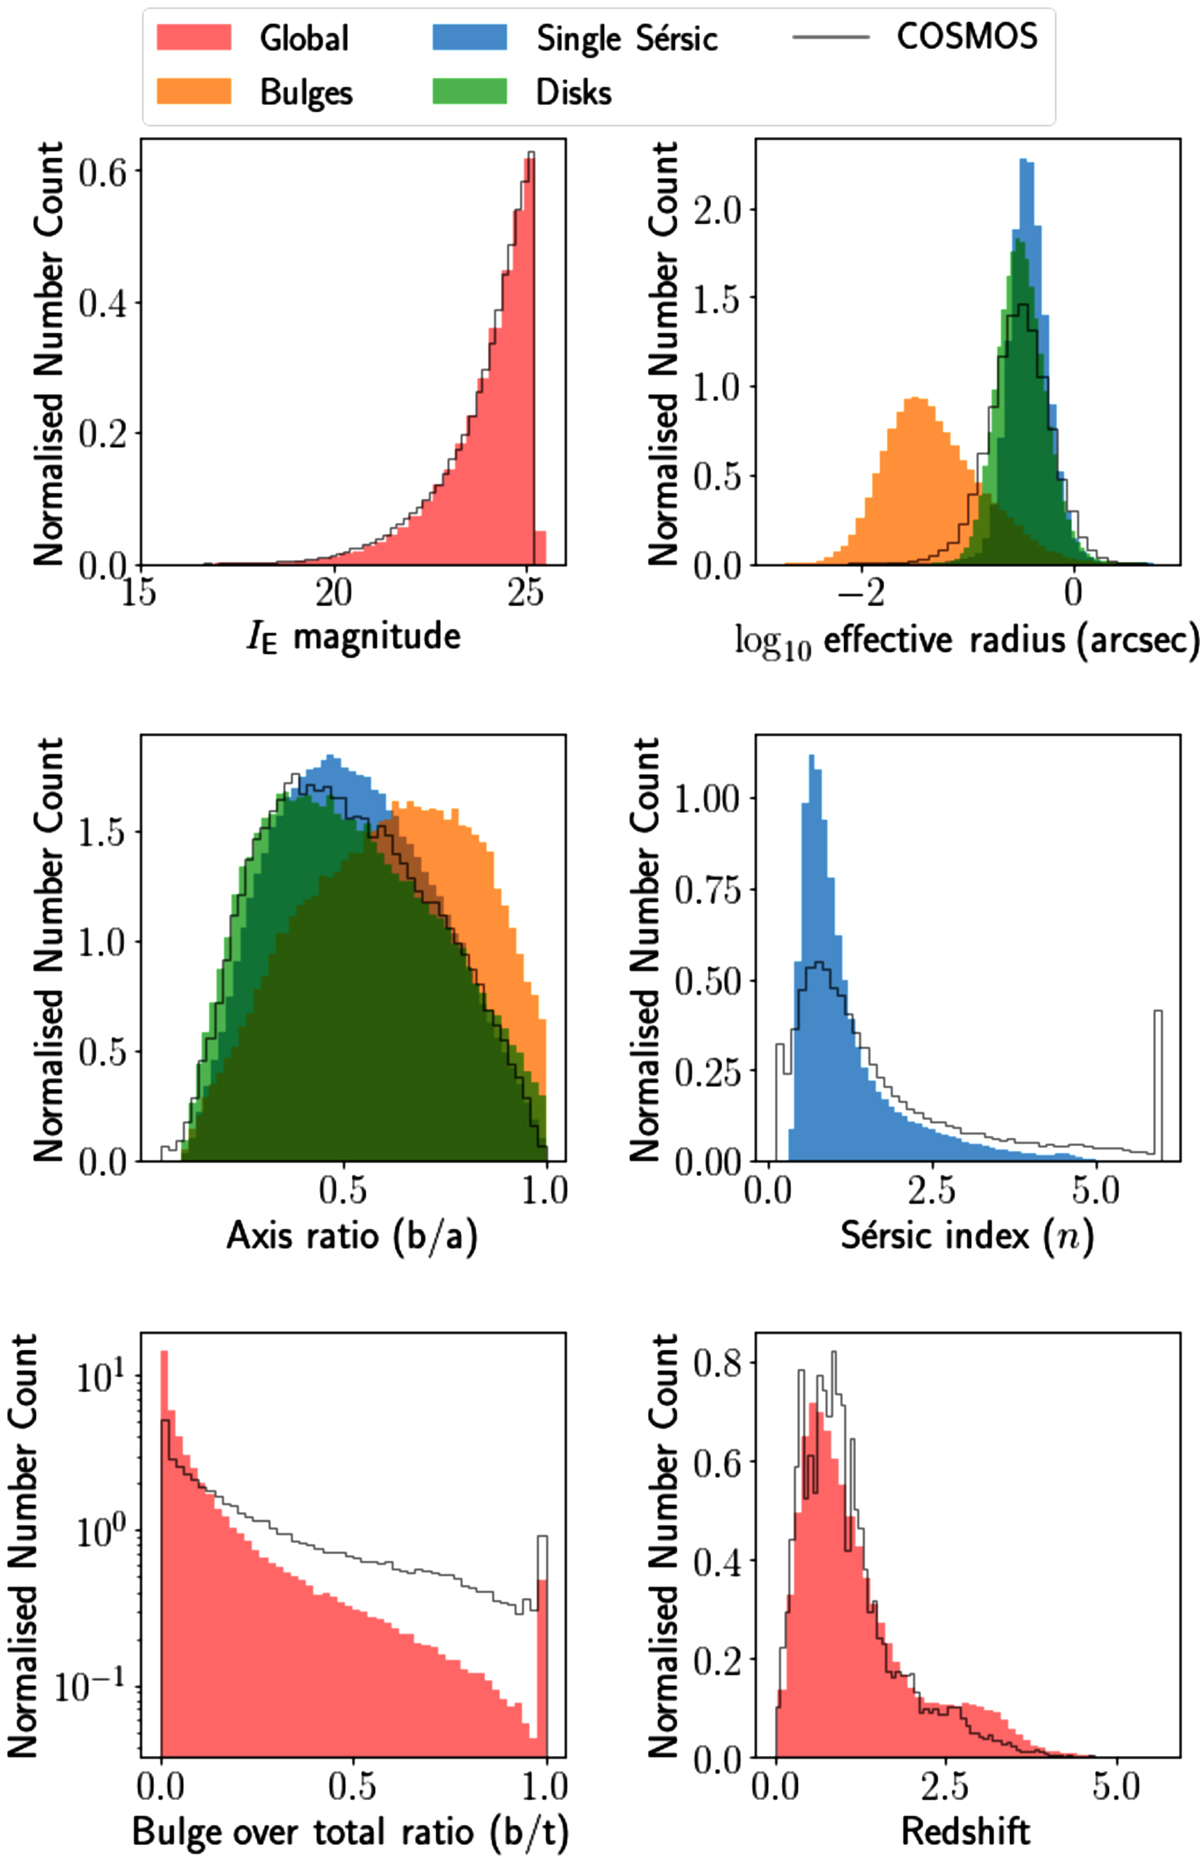
Download original image
Distributions of the simulated ‘true’ galaxy parameters measured in the Euclid Morphology Challenge. Top left: IE distribution down to 5σ detections. Top right: effective radii for the single component galaxy (blue), and for bulges (orange), and discs (green) separately. Middle Left: Axis ratio distributions. Middle right: Sérsic index distributions for single-component galaxies. We note that Sérsic indices of the bulges are fixed to n = 4, and the discs to n = 1. Bottom left shows the bulge-to-total ratio distribution. The black solid line shows the COSMOS distribution. We also note that for b/t, the y-axis is on a logarithmic scale. The distributions are normalised such that the area is equal to 1. This figure is replicated from EMC2023.
Current usage metrics show cumulative count of Article Views (full-text article views including HTML views, PDF and ePub downloads, according to the available data) and Abstracts Views on Vision4Press platform.
Data correspond to usage on the plateform after 2015. The current usage metrics is available 48-96 hours after online publication and is updated daily on week days.
Initial download of the metrics may take a while.