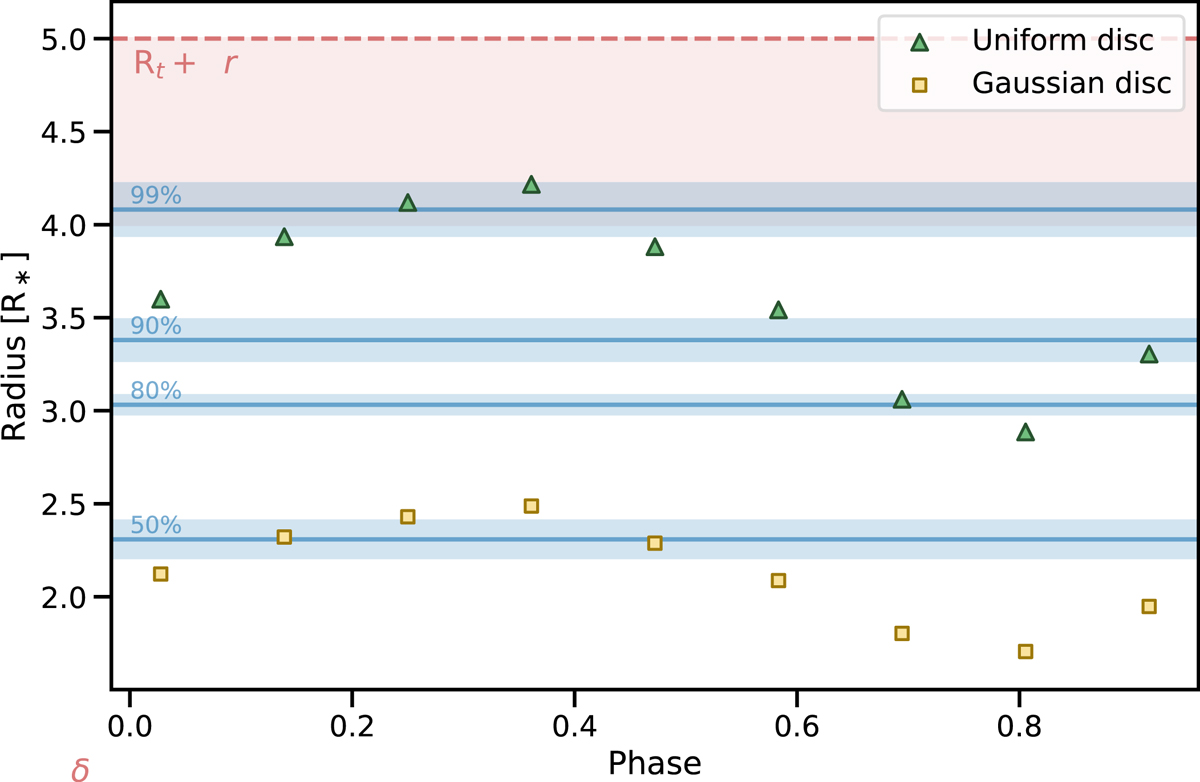
Fig. 6.
Download original image
Interferometric radii as function of rotational phase. Uniform and Gaussian disc models are shown with green and yellow markers, respectively. Blue lines correspond to the radii encompassing 50, 80, 90, and 99% of the total RT model’s flux. The blue shaded areas represent the standard deviation of these radii across the rotational phase. The red shaded area indicates the inner (Rt) and outer radius (Rt + δr) of the RT model.
Current usage metrics show cumulative count of Article Views (full-text article views including HTML views, PDF and ePub downloads, according to the available data) and Abstracts Views on Vision4Press platform.
Data correspond to usage on the plateform after 2015. The current usage metrics is available 48-96 hours after online publication and is updated daily on week days.
Initial download of the metrics may take a while.