Fig. 5.
Download original image
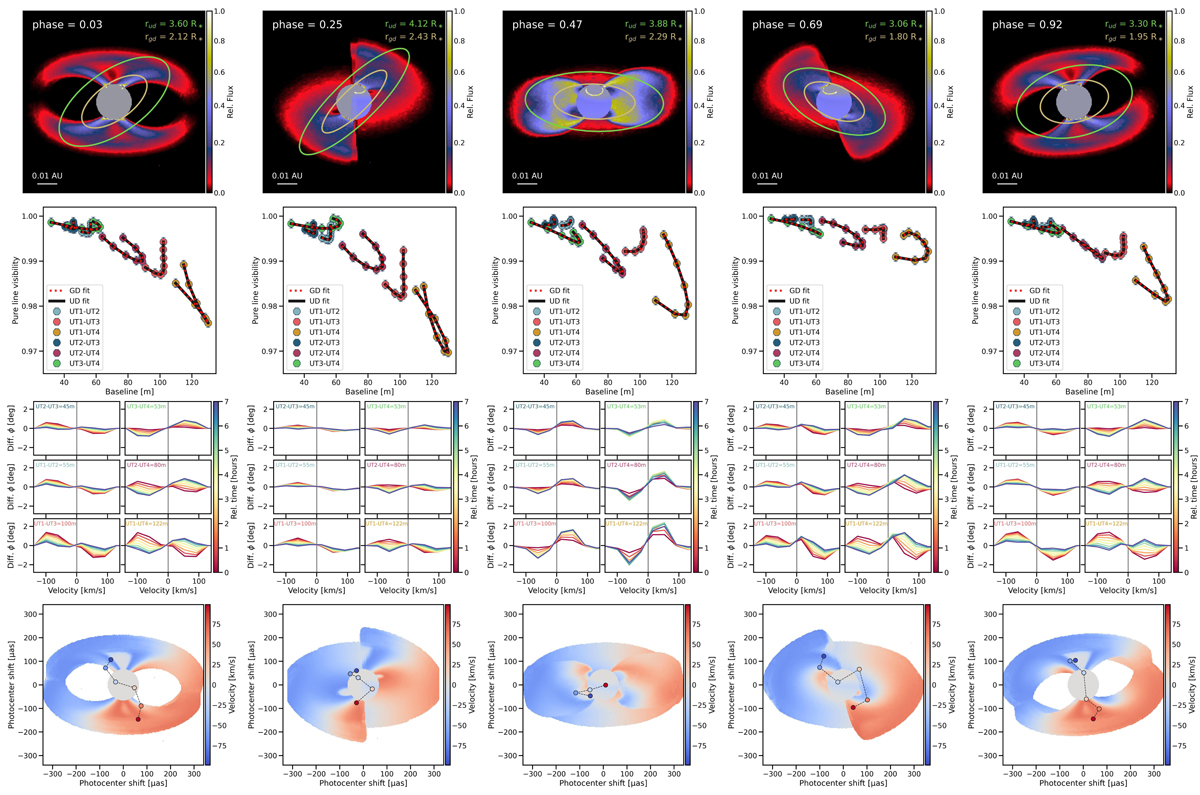
Synthetic interferometric measurements and modelling across the rotational phase of the system. Top: integrated images over the Brγ line. Green (uniform disc) and yellow (Gaussian disc) ellipses are the characteristic sizes measured with a GRAVITY-like instrument. Middle-top: pure line visibility amplitude observables associated with the corresponding models. The visibility variation (for a given baseline) as the uv plane rotates is the specific signature of an elongated object. Middle-bottom: pure phase visibility across the line profile for the six baselines of the VLTI. Colours encode the observing time. Bottom: velocity map of the radiative transfer model. The coloured dots represent the measurement of the photo-centre derived from the phase visibility in each available spectral channel (see Appendix B). In each figure, the magnetosphere and the stellar surface have been normalised independently for display purposes.
Current usage metrics show cumulative count of Article Views (full-text article views including HTML views, PDF and ePub downloads, according to the available data) and Abstracts Views on Vision4Press platform.
Data correspond to usage on the plateform after 2015. The current usage metrics is available 48-96 hours after online publication and is updated daily on week days.
Initial download of the metrics may take a while.