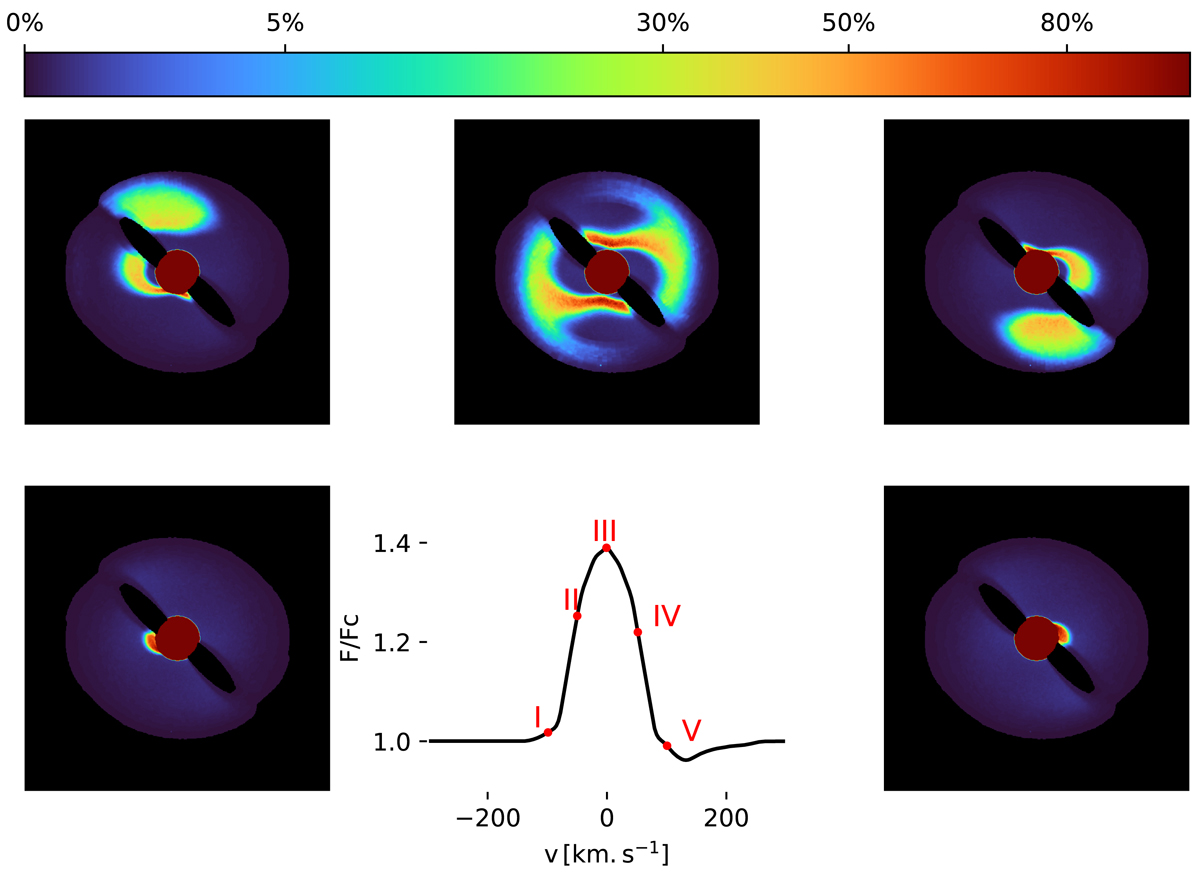
Fig. 2.
Download original image
Origin of emission seen across the Brackett γ line. The contribution of individual images to the total line flux is indicated on the central image showing the line profile. The brightness maps are in units of the maximum emission. The emission of the stellar surface is saturated. Orange to red colours indicate the regions of maximum emission. The system is seen at an inclination of 30° and an rotational phase of ∼0.25, similarly to Fig. 1.
Current usage metrics show cumulative count of Article Views (full-text article views including HTML views, PDF and ePub downloads, according to the available data) and Abstracts Views on Vision4Press platform.
Data correspond to usage on the plateform after 2015. The current usage metrics is available 48-96 hours after online publication and is updated daily on week days.
Initial download of the metrics may take a while.