Fig. 3
Download original image
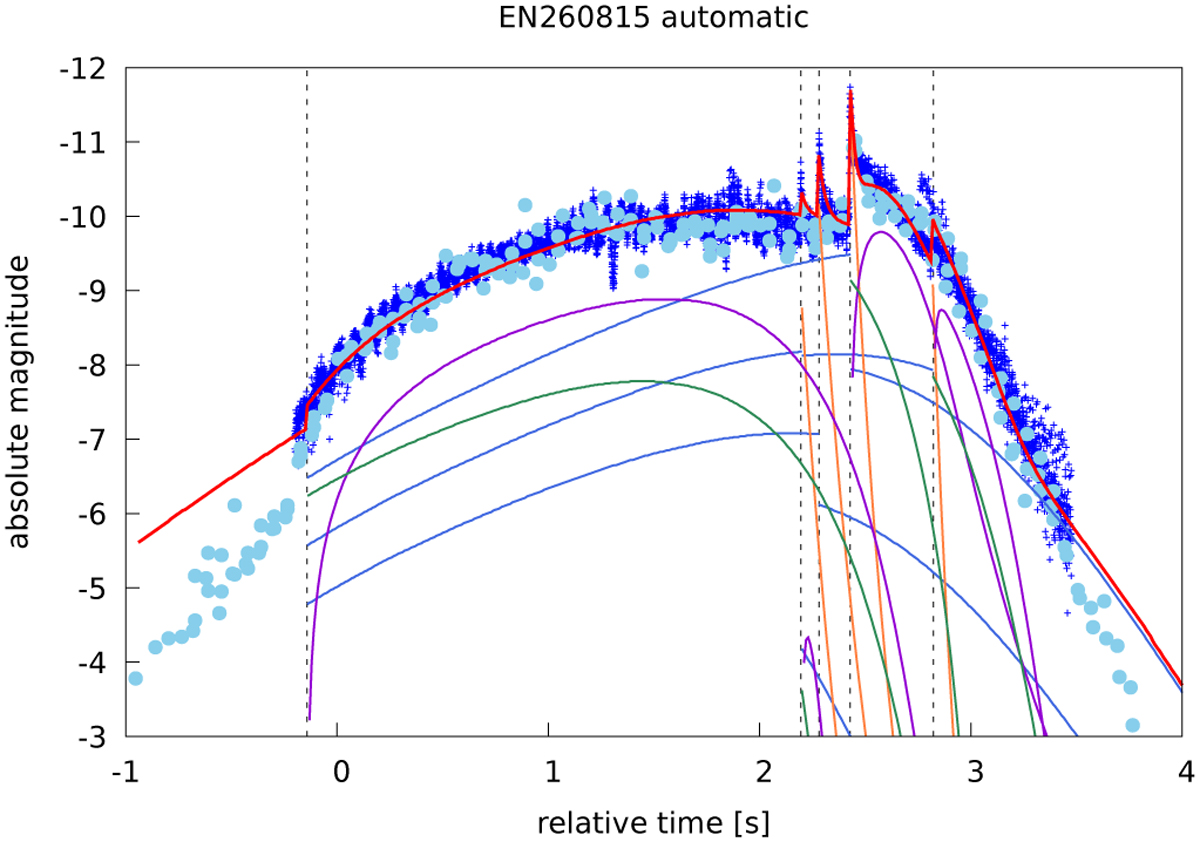
Automatic solution of the EN260815 fragmentation compared to the observed radiometric curve (dark blue pluses) and a photometric light curve (sky blue disks). The total model brightness is shown as a solid red line, the brightness of regular fragments is shown as blue curves, green curves signify eroding fragments, violet lines indicate dust particles released from these fragments, and orange curves denote regular dust released in gross fragmentations. Fragmentation times are shown with vertical dashed lines.
Current usage metrics show cumulative count of Article Views (full-text article views including HTML views, PDF and ePub downloads, according to the available data) and Abstracts Views on Vision4Press platform.
Data correspond to usage on the plateform after 2015. The current usage metrics is available 48-96 hours after online publication and is updated daily on week days.
Initial download of the metrics may take a while.