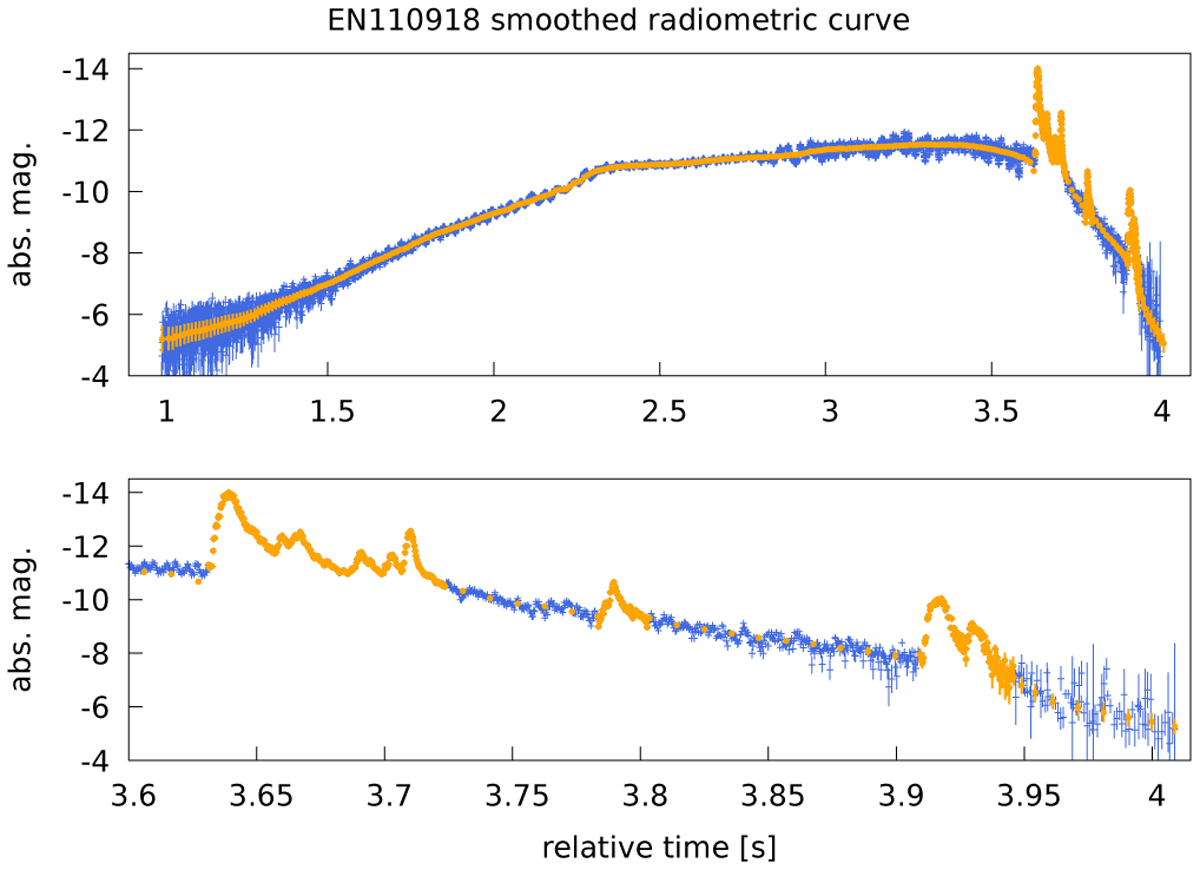
Fig. 2
Download original image
Smoothed radiometric curve of the EN110918 shown by orange dots with error impulses, compared with the original, labeled by blue pluses with error impulses. The upper panel shows the whole radiometric curve, and the lower panel shows the end of it in greater detail. The flares are copied from the original curve, and the other parts are filtered using the median running box.
Current usage metrics show cumulative count of Article Views (full-text article views including HTML views, PDF and ePub downloads, according to the available data) and Abstracts Views on Vision4Press platform.
Data correspond to usage on the plateform after 2015. The current usage metrics is available 48-96 hours after online publication and is updated daily on week days.
Initial download of the metrics may take a while.