Fig. 8.
Download original image
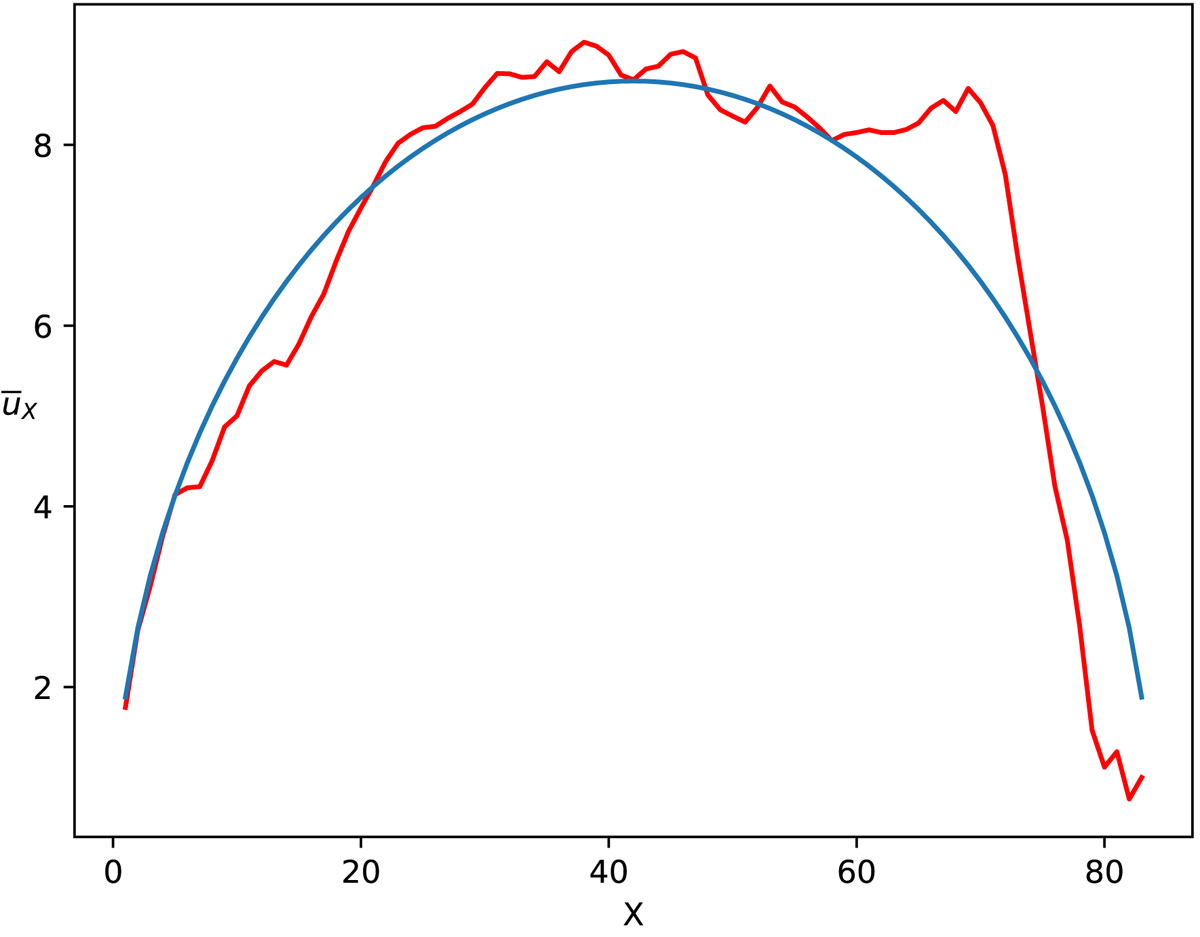
Application of the test of Eddington & Plakidis (1929) to the 84 reconstructed cycles on the basis of the 14C data. Shown is the mean accumulated phase error after x cycles as a function of x. The red curve results from the activity minima of the reconstructed cycles, the blue curve is the corresponding fit to the theoretical relation given by Eq. (23) for x ≤ 50. The resulting fit parameters clearly indicate that the system shows random walk of phase.
Current usage metrics show cumulative count of Article Views (full-text article views including HTML views, PDF and ePub downloads, according to the available data) and Abstracts Views on Vision4Press platform.
Data correspond to usage on the plateform after 2015. The current usage metrics is available 48-96 hours after online publication and is updated daily on week days.
Initial download of the metrics may take a while.