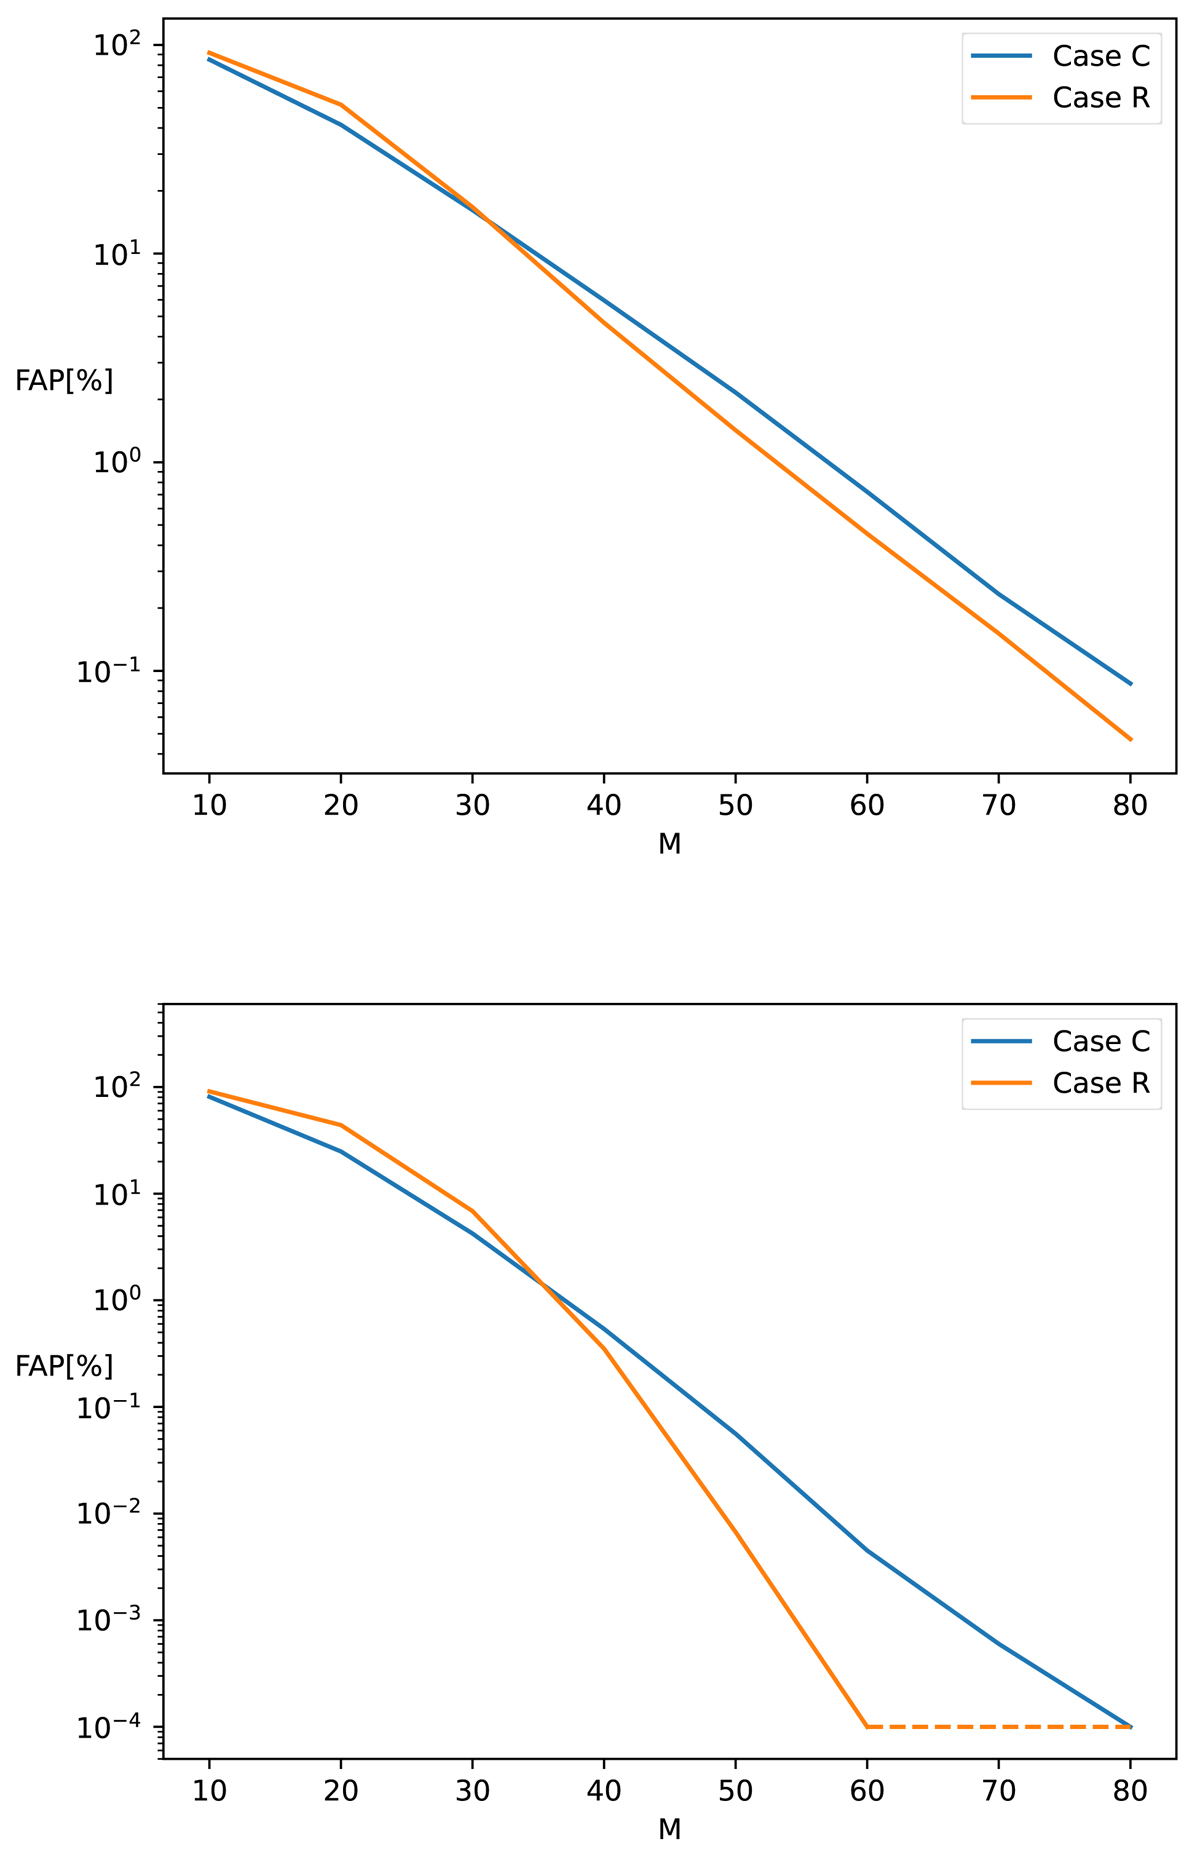
Fig. 7.
Download original image
False-alarm probabilities as a function of the total number of cycles in the data set, based on Monte Carlo simulations. Upper panel: (Corrected) Original method of Gough (1981). Lower panel: modified method (Gough 1983). The red lines give the FAP that a realization of case C falls within the 99% confidence interval for case R, and vice versa for the blue lines. The dashed line segment indicates an upper limit.
Current usage metrics show cumulative count of Article Views (full-text article views including HTML views, PDF and ePub downloads, according to the available data) and Abstracts Views on Vision4Press platform.
Data correspond to usage on the plateform after 2015. The current usage metrics is available 48-96 hours after online publication and is updated daily on week days.
Initial download of the metrics may take a while.