Fig. 5.
Download original image
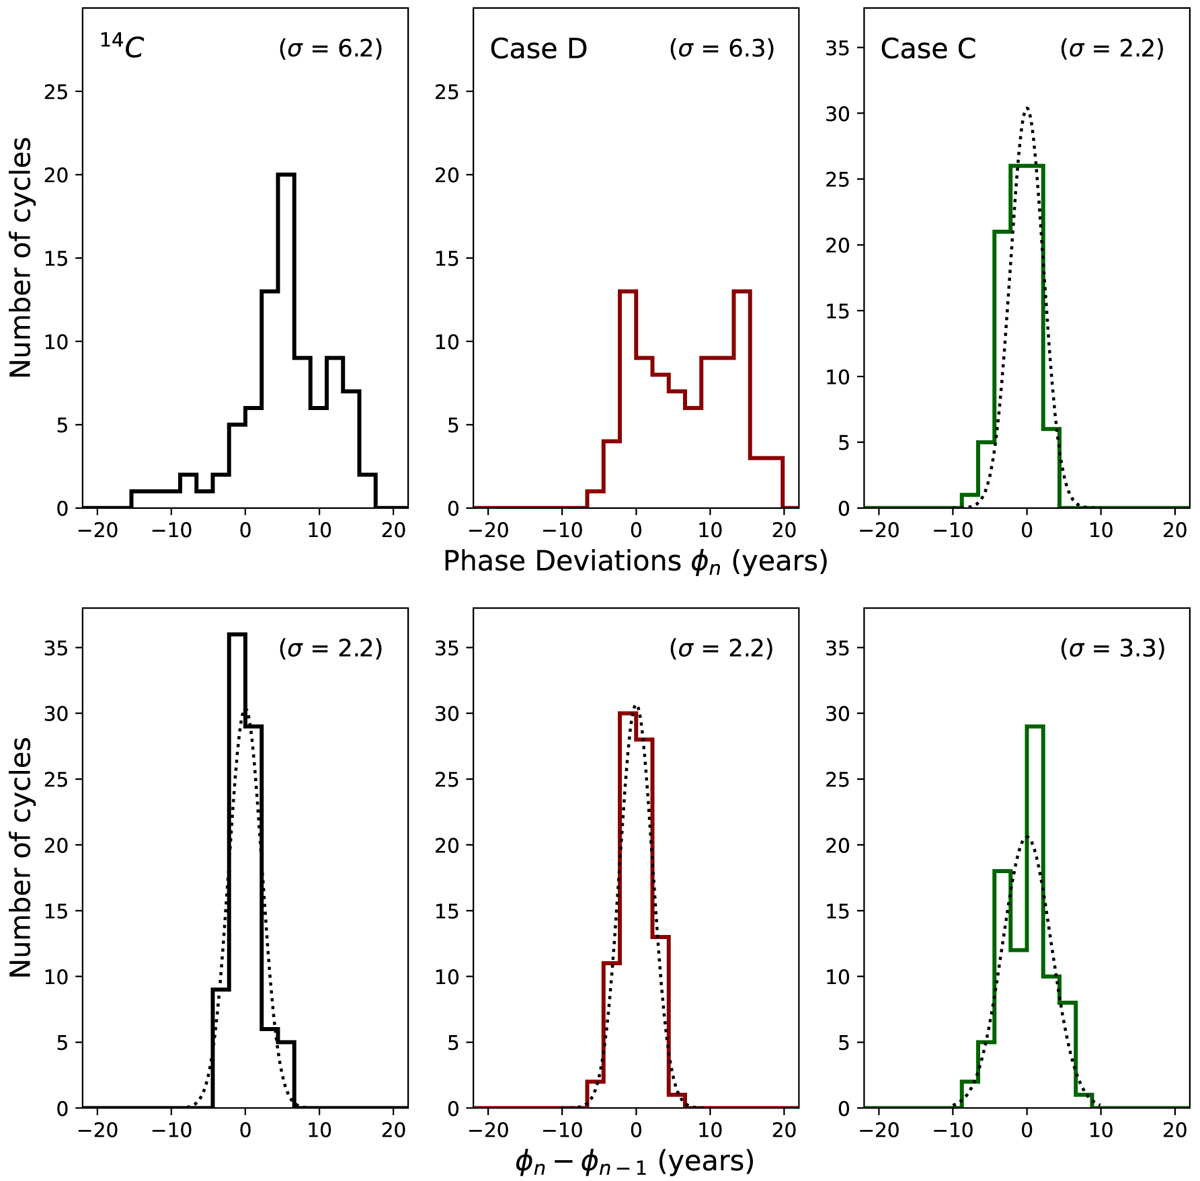
Distributions of phase deviations (upper panels) and inferred phase fluctuations (differences between subsequent phase deviations, lower panels) for the 84 reconstructed cycles from the 14C data (left panels) and for simulated cycles with Gaussian fluctuations corresponding to case R (middle panels) and case C (right panels). The dotted curves indicate Gaussian fits.
Current usage metrics show cumulative count of Article Views (full-text article views including HTML views, PDF and ePub downloads, according to the available data) and Abstracts Views on Vision4Press platform.
Data correspond to usage on the plateform after 2015. The current usage metrics is available 48-96 hours after online publication and is updated daily on week days.
Initial download of the metrics may take a while.