Fig. 4.
Download original image
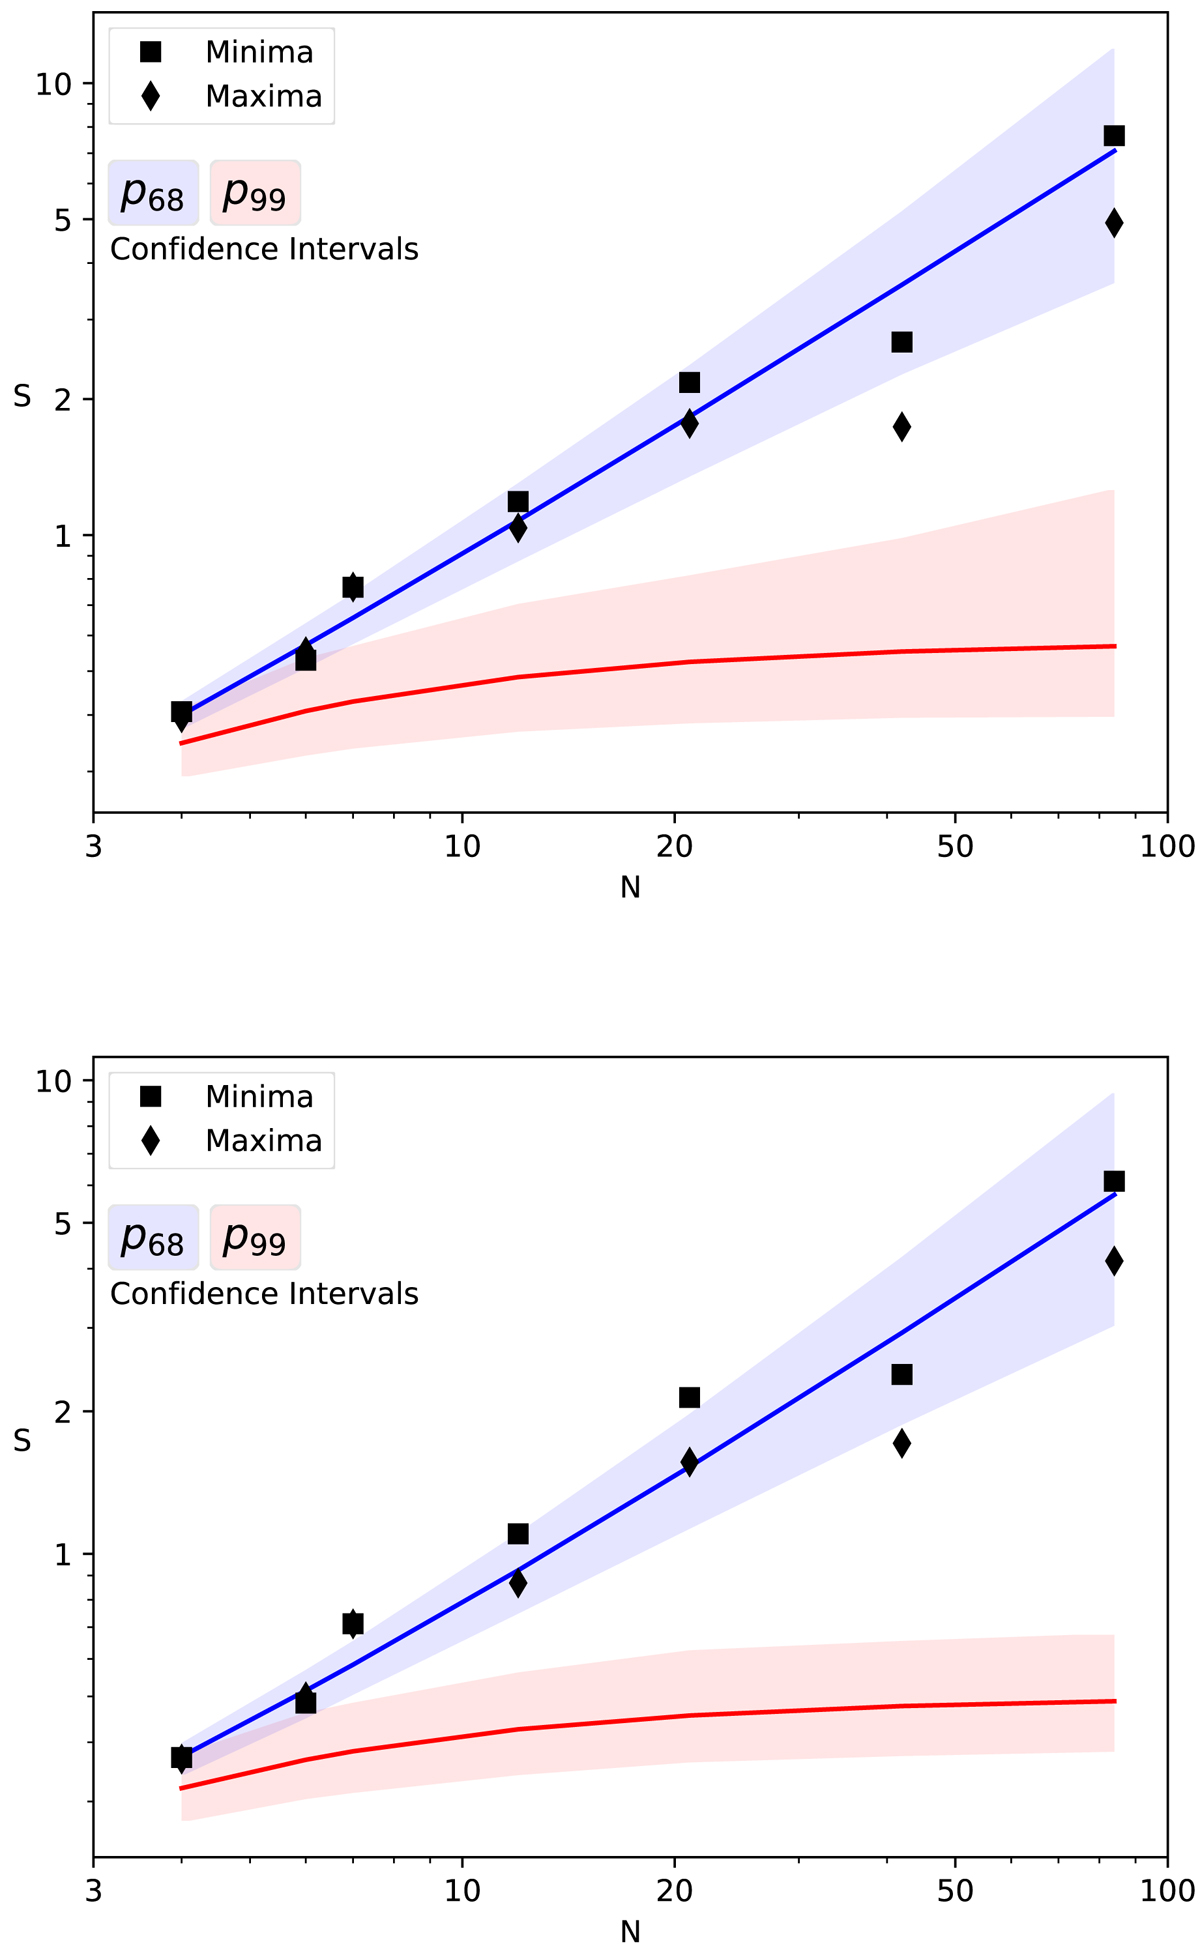
Application of the statistical analysis to the series of 84 cycles covering the period between the years 976 and 1888 as reconstructed from 14C data by (Usoskin et al. 2021). Upper panel: (Corrected) Original method of Gough (1981). Lower panel: modified method (Gough 1983). The graphical representation of the results is the same as in the previous figures. The data are consistent with random walk of phase (case R) while, owing to the much longer data set, clock synchronization is rejected at levels exceeding 99%.
Current usage metrics show cumulative count of Article Views (full-text article views including HTML views, PDF and ePub downloads, according to the available data) and Abstracts Views on Vision4Press platform.
Data correspond to usage on the plateform after 2015. The current usage metrics is available 48-96 hours after online publication and is updated daily on week days.
Initial download of the metrics may take a while.