Fig. 2.
Download original image
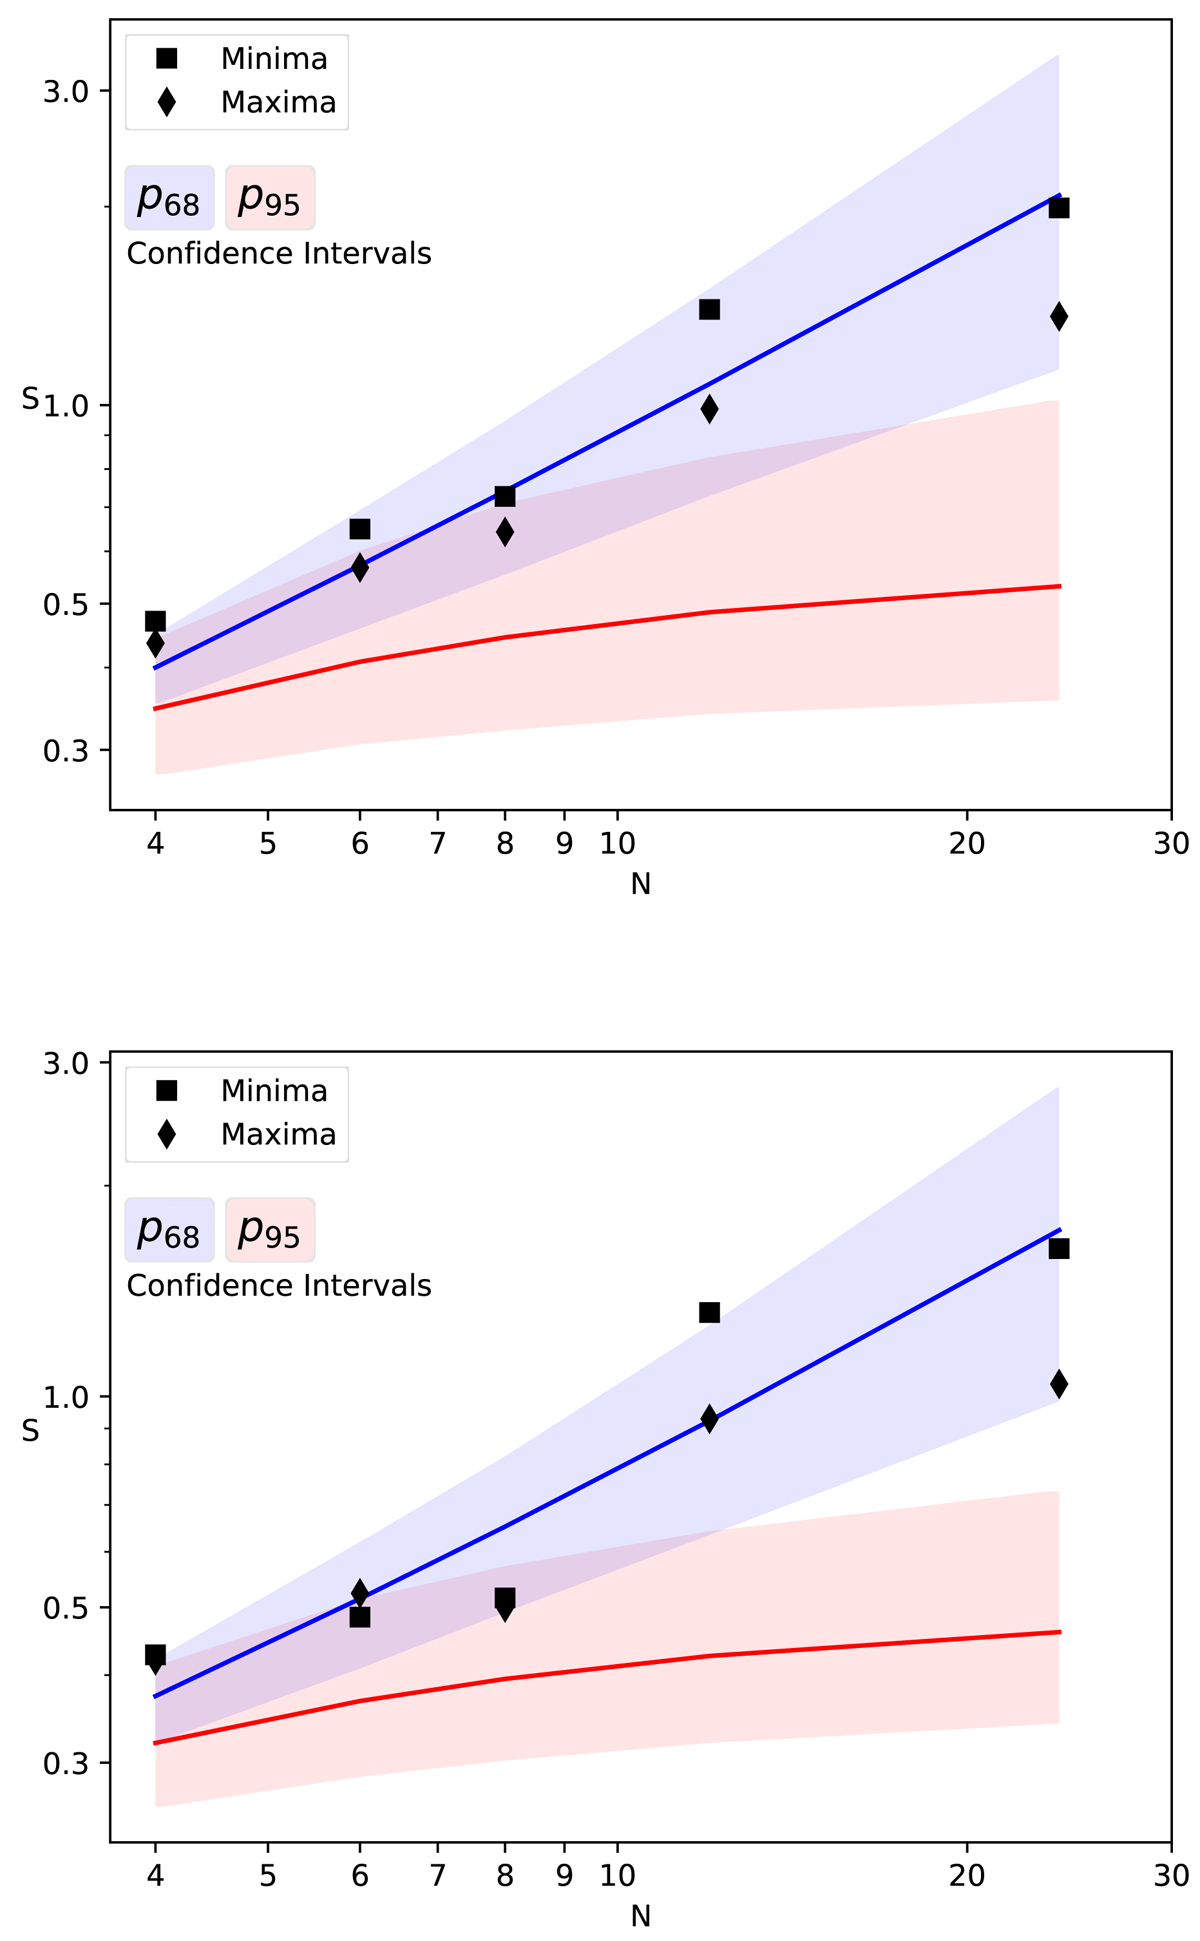
Application of the statistical methods of Gough (1981, 1983) to the epochs of sunspot minima and maxima of 24 activity cycles between 1712 and 1976. Upper panel: (Corrected) Original method of Gough (1981). Lower panel: modified method (Gough 1983). In both panels, the symbols show the ratio ![]() as a function of N (number of cycles in the data segments) for cycle minima (squares) and maxima (rhombs). The lines indicate the ratio of the expectation values,
as a function of N (number of cycles in the data segments) for cycle minima (squares) and maxima (rhombs). The lines indicate the ratio of the expectation values, ![]() for case R (random walk of phase; blue curve) and case C (clock synchronization; red curve), respectively. The shaded areas show one-sided 68% (p68) and 95% (p95) percentiles determined from 10 000 Monte-Carlo simulations for each case. In both panels, the data points align well with the curve corresponding to case R (random walk) while case C (synchronization) is rejected at a confidence level of at least 95%.
for case R (random walk of phase; blue curve) and case C (clock synchronization; red curve), respectively. The shaded areas show one-sided 68% (p68) and 95% (p95) percentiles determined from 10 000 Monte-Carlo simulations for each case. In both panels, the data points align well with the curve corresponding to case R (random walk) while case C (synchronization) is rejected at a confidence level of at least 95%.
Current usage metrics show cumulative count of Article Views (full-text article views including HTML views, PDF and ePub downloads, according to the available data) and Abstracts Views on Vision4Press platform.
Data correspond to usage on the plateform after 2015. The current usage metrics is available 48-96 hours after online publication and is updated daily on week days.
Initial download of the metrics may take a while.