Fig. 8.
Download original image
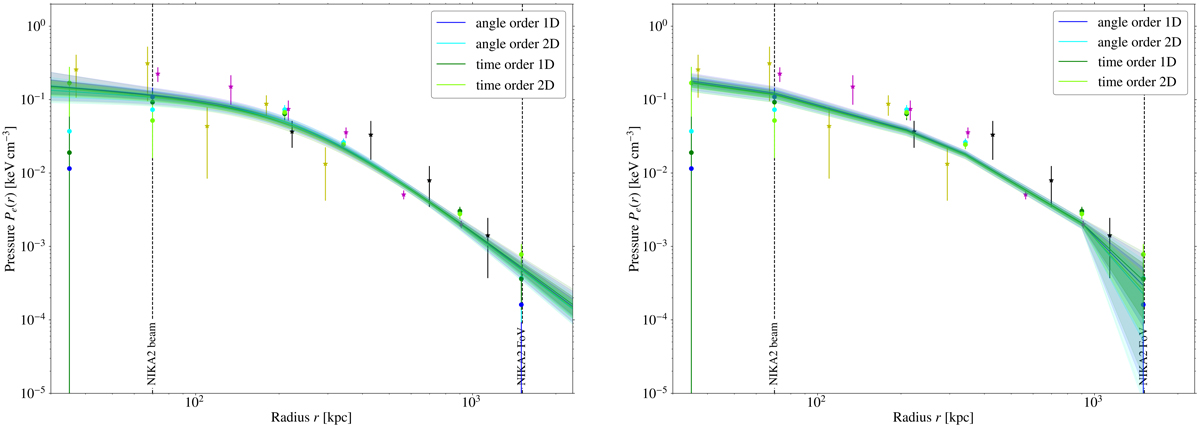
Pressure profile and best fit for the gNFW (left) and NFW (right) models. The data points correspond to the NIKA2 radially binned results for the four data sets discussed above, and to the NIKA, MUSTANG, and Bolocam bins from R18. Blue and green solid lines represent the best-fit values for the four NIKA2 pressure estimates considered. The shaded regions show the 2.5th, 16th, 84th, and 97.5th percentiles.
Current usage metrics show cumulative count of Article Views (full-text article views including HTML views, PDF and ePub downloads, according to the available data) and Abstracts Views on Vision4Press platform.
Data correspond to usage on the plateform after 2015. The current usage metrics is available 48-96 hours after online publication and is updated daily on week days.
Initial download of the metrics may take a while.