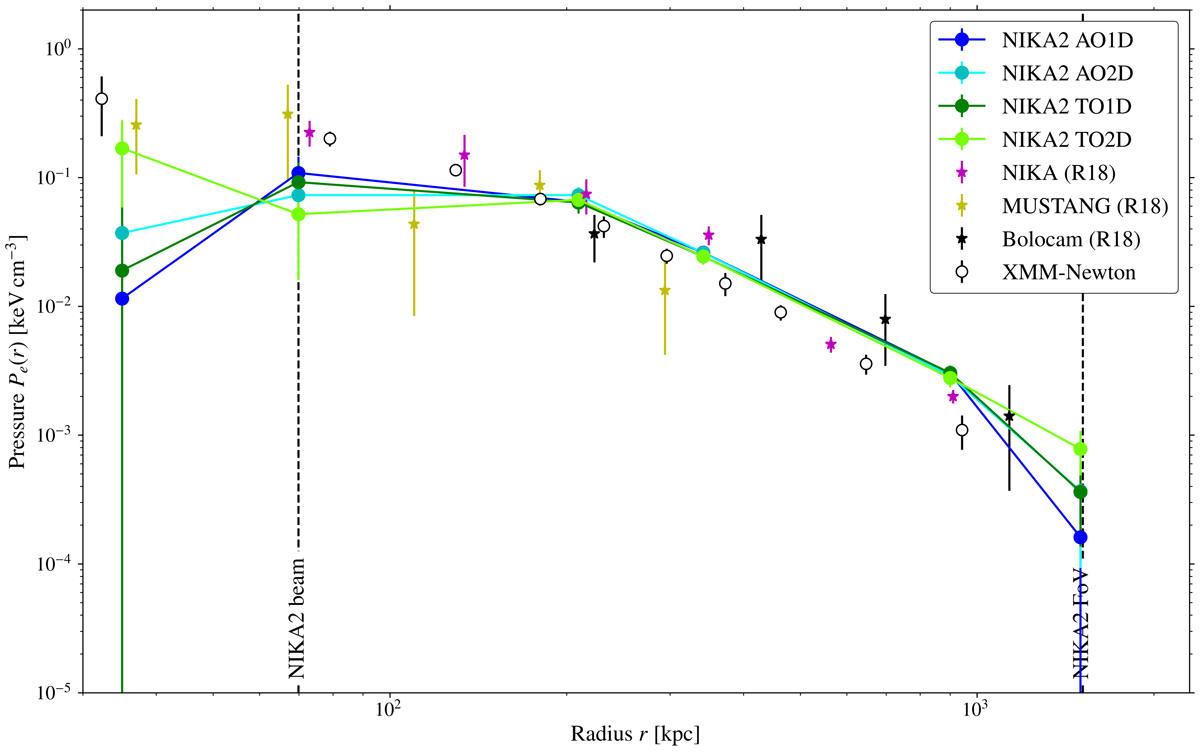
Fig. 6.
Download original image
Pressure profile of the ICM of CL J1226.9+3332. Blue and green symbols correspond to the results obtained in this work from the NIKA2 150 GHz map. The error bar edges represent the 1σ uncertainties. Pink, yellow, and black stars show the reconstructed profiles in R18 for NIKA, MUSTANG, and Bolocam data, respectively. Empty symbols correspond to the pressure profile obtained from the combination of XMM-Newton electron density and temperature profiles. Vertical dashed lines indicate the instrumental limits of NIKA2 as radius of the beam and FoV.
Current usage metrics show cumulative count of Article Views (full-text article views including HTML views, PDF and ePub downloads, according to the available data) and Abstracts Views on Vision4Press platform.
Data correspond to usage on the plateform after 2015. The current usage metrics is available 48-96 hours after online publication and is updated daily on week days.
Initial download of the metrics may take a while.