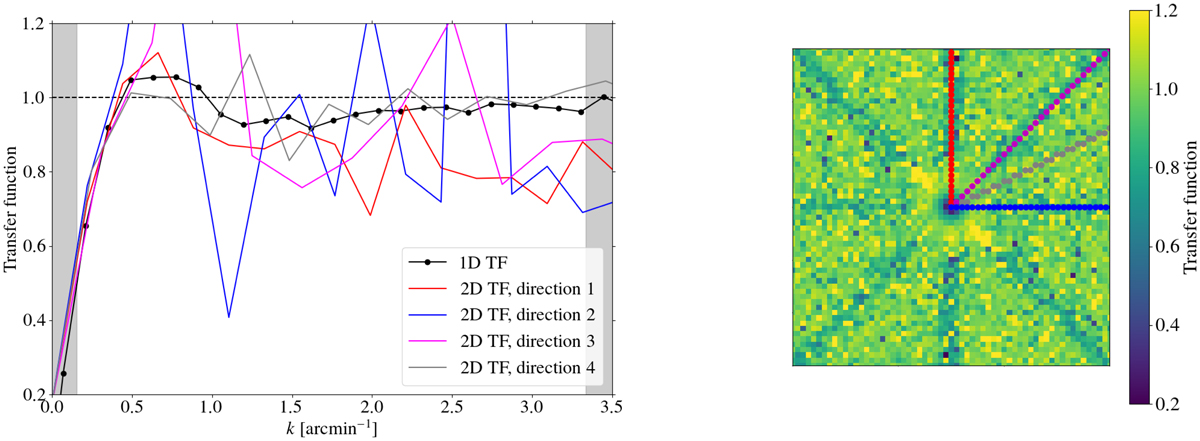
Fig. 4.
Download original image
Transfer functions, 1D (left) and 2D (right), describing the filtering induced by data processing for the 150 GHz map in Fig. 2. The coloured lines in the left panel represent the values of the 2D transfer function for the directions shown with the same colours in the right panel. Grey-shaded areas correspond to the NIKA2 field of view (for small angular frequencies) and beam FWHM (for large angular frequencies) instrumental limits.
Current usage metrics show cumulative count of Article Views (full-text article views including HTML views, PDF and ePub downloads, according to the available data) and Abstracts Views on Vision4Press platform.
Data correspond to usage on the plateform after 2015. The current usage metrics is available 48-96 hours after online publication and is updated daily on week days.
Initial download of the metrics may take a while.