Fig. 13.
Download original image
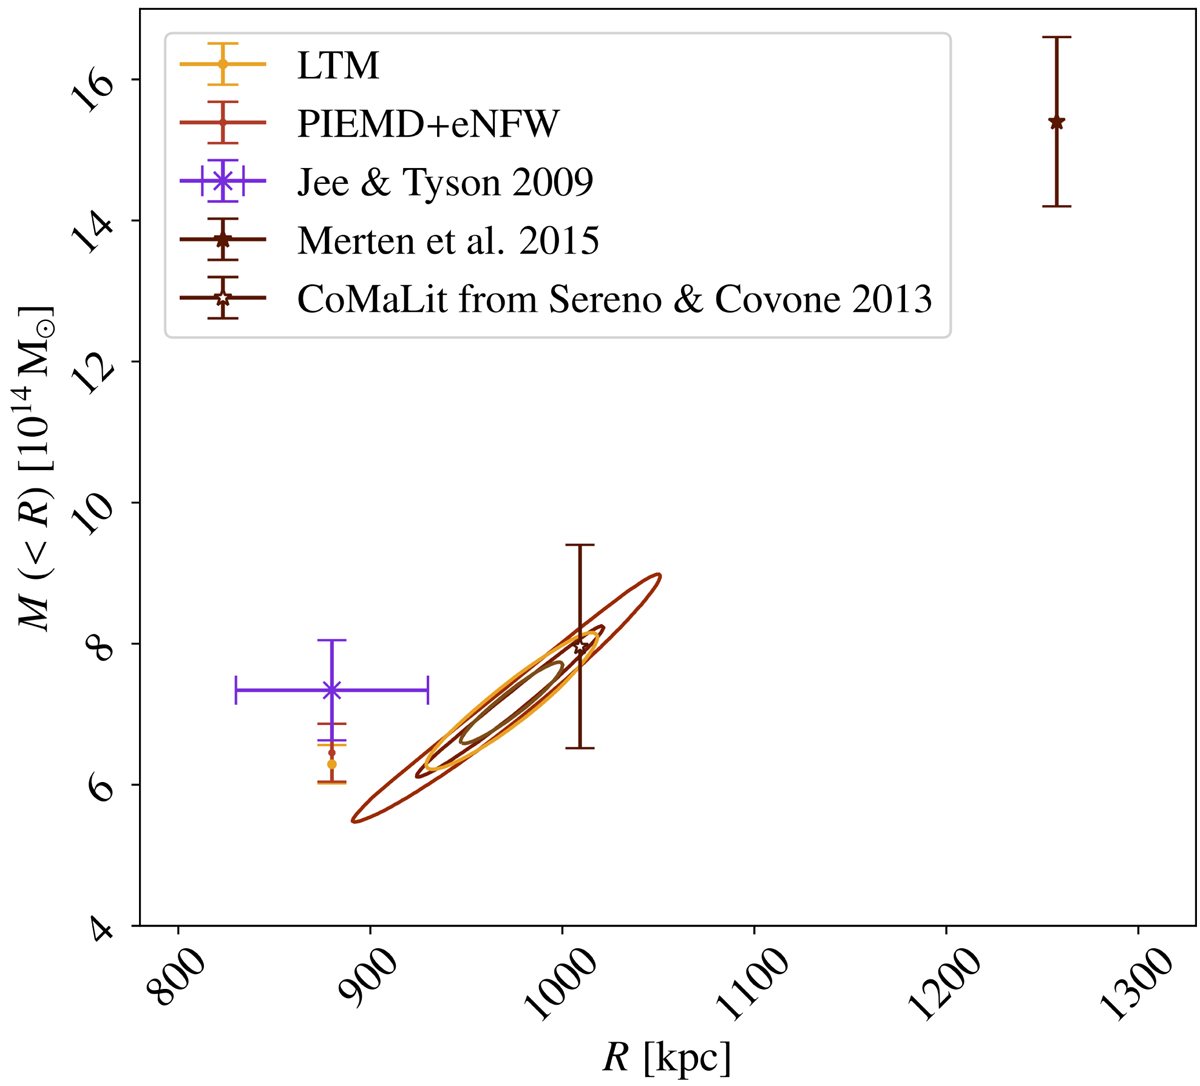
Probabiliy distribution for ![]() and
and ![]() obtained from the fit of the NFW density profile model on the CLASH PIEMD+eNFW (red) and LTM (orange) convergence maps. Shown are the 1 and 2σ contours. The purple cross corresponds to the lensing mass estimate in Jee & Tyson (2009). For comparison, also shown are lensing masses estimated at 880 kpc for the PIEMD+eNFW (red) and LTM (orange) as vertical error bars at 1σ. The brown stars correspond to
obtained from the fit of the NFW density profile model on the CLASH PIEMD+eNFW (red) and LTM (orange) convergence maps. Shown are the 1 and 2σ contours. The purple cross corresponds to the lensing mass estimate in Jee & Tyson (2009). For comparison, also shown are lensing masses estimated at 880 kpc for the PIEMD+eNFW (red) and LTM (orange) as vertical error bars at 1σ. The brown stars correspond to ![]() from literature: Merten et al. (2015, filled) and Sereno (2015), Sereno & Covone (2013, empty).
from literature: Merten et al. (2015, filled) and Sereno (2015), Sereno & Covone (2013, empty).
Current usage metrics show cumulative count of Article Views (full-text article views including HTML views, PDF and ePub downloads, according to the available data) and Abstracts Views on Vision4Press platform.
Data correspond to usage on the plateform after 2015. The current usage metrics is available 48-96 hours after online publication and is updated daily on week days.
Initial download of the metrics may take a while.