Fig. 8.
Download original image
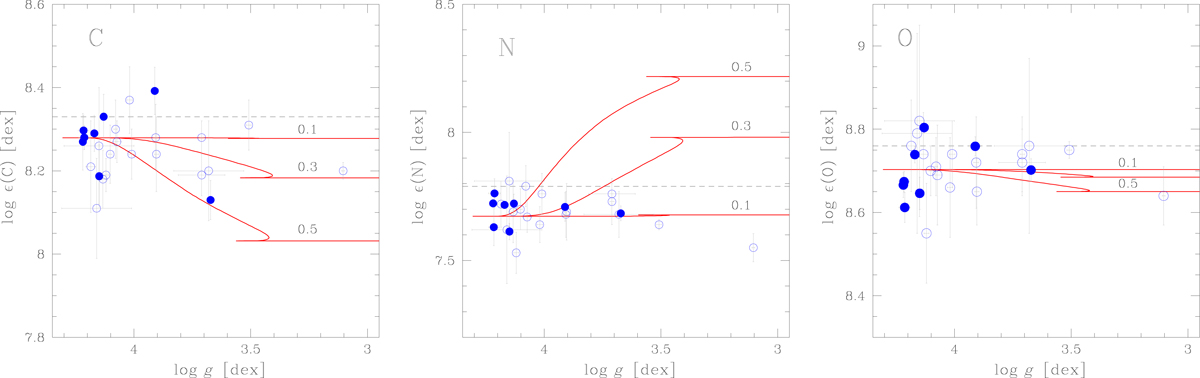
Individual abundances of carbon (left), nitrogen (middle), and oxygen (right) as a function of surface gravity. The stars in the present sample are indicated with filled blue circles, while stars taken from our previous studies are shown with open blue circles. The surface gravity (obtained from the binary solution) is used as a proxy for stellar evolution. Solid red lines show theoretical evolutionary tracks for a 15 M⊙ star and three values of the initial rotational velocity, Ω/Ωcrit = 0.1, 0.3, and 0.5 (Georgy et al. 2013). The cosmic standard abundance values of Nieva & Przybilla (2012) are indicated with horizontal dashed lines.
Current usage metrics show cumulative count of Article Views (full-text article views including HTML views, PDF and ePub downloads, according to the available data) and Abstracts Views on Vision4Press platform.
Data correspond to usage on the plateform after 2015. The current usage metrics is available 48-96 hours after online publication and is updated daily on week days.
Initial download of the metrics may take a while.