Fig. 6.
Download original image
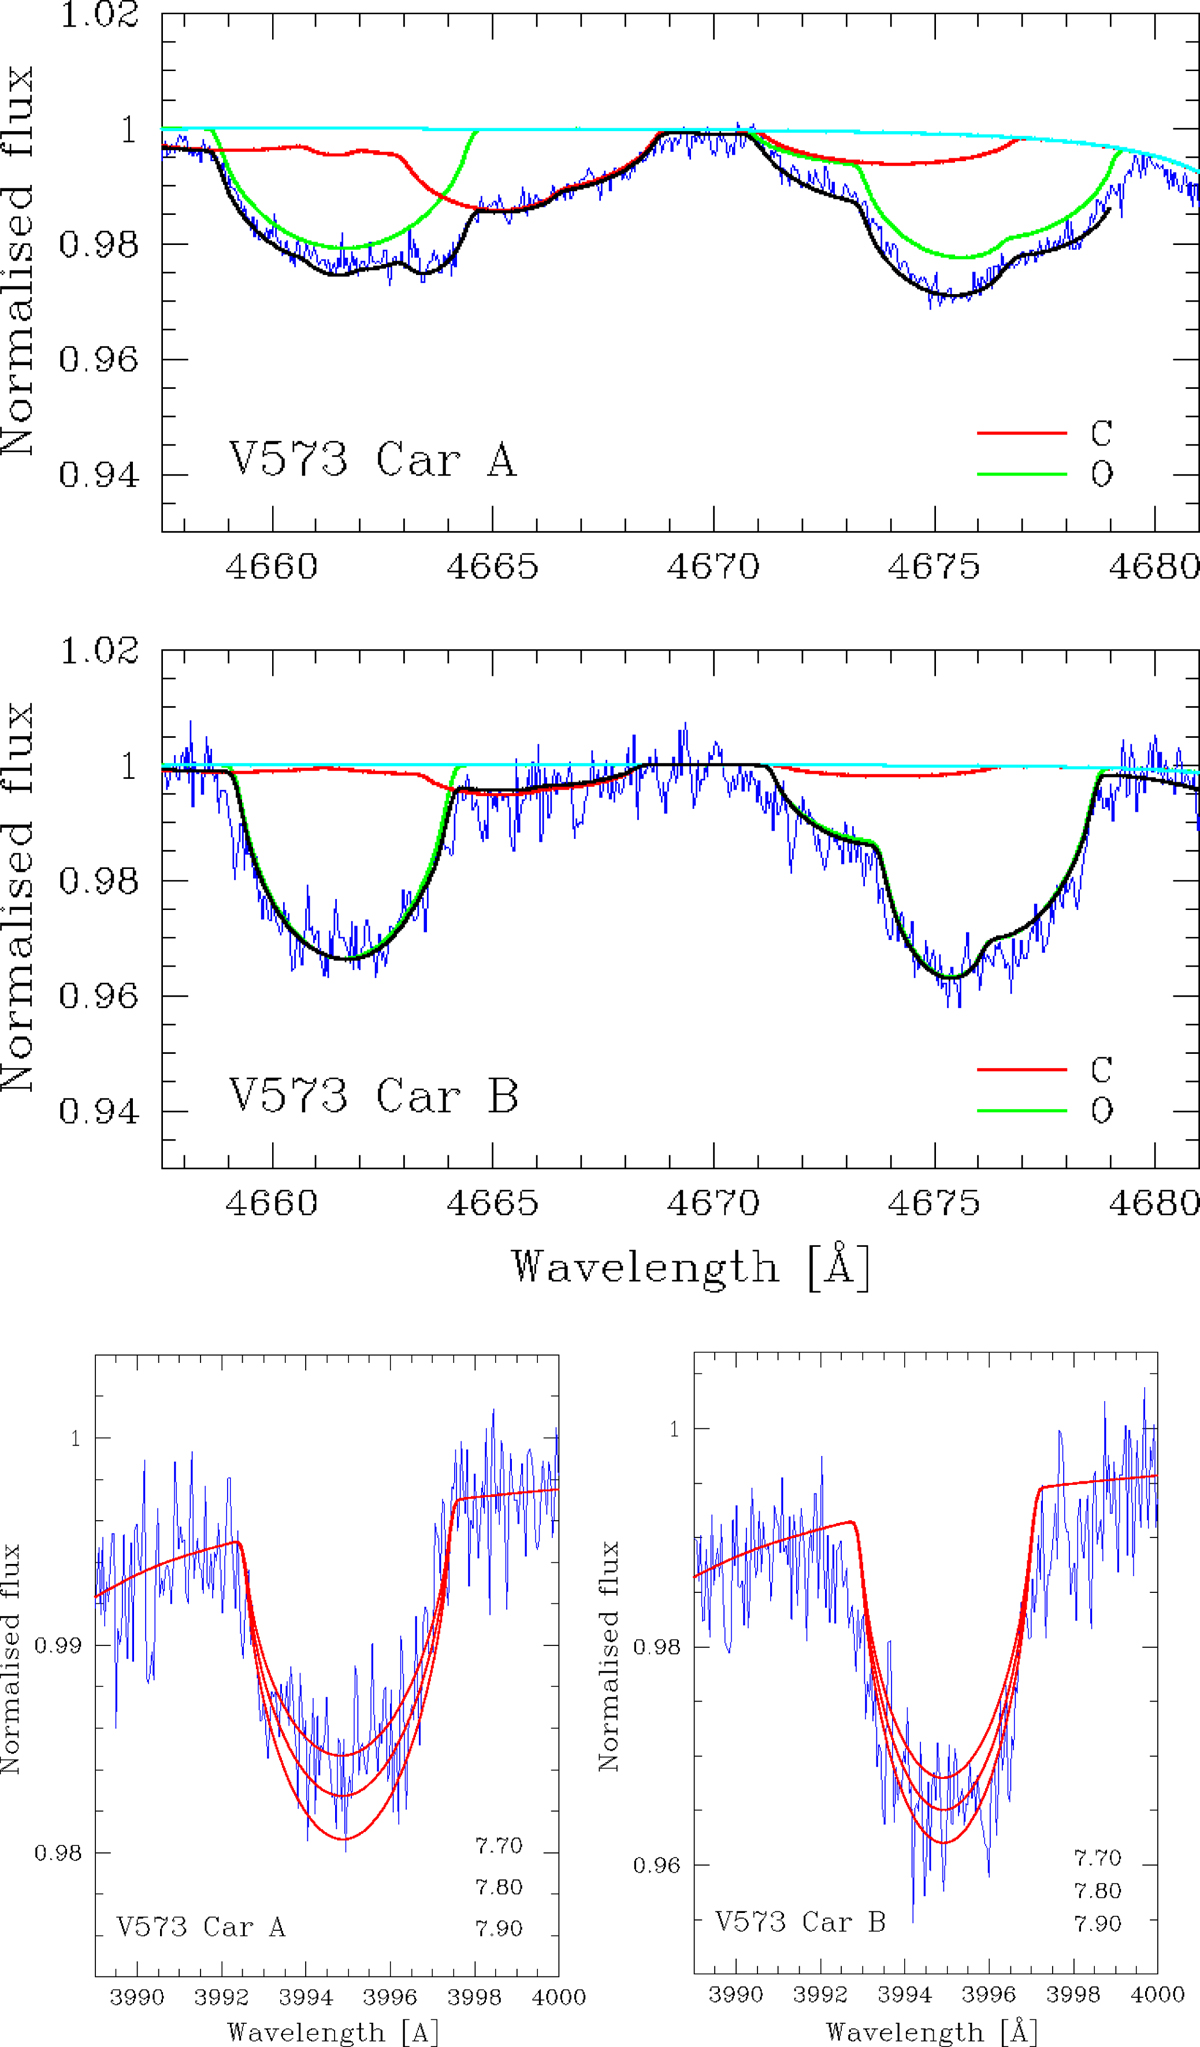
Same as Fig. 4 but for lines in the components of V573 Car. The upper two panels show O II lines at 4661, 4673, and 4676 Å (green lines), which are blended with C II lines at 4659, 4663, 4665, and 4673 Å (red lines). The calculated synthetic spectrum is shown using a black line. The lower two panels show the N II 3995 Å lines.
Current usage metrics show cumulative count of Article Views (full-text article views including HTML views, PDF and ePub downloads, according to the available data) and Abstracts Views on Vision4Press platform.
Data correspond to usage on the plateform after 2015. The current usage metrics is available 48-96 hours after online publication and is updated daily on week days.
Initial download of the metrics may take a while.