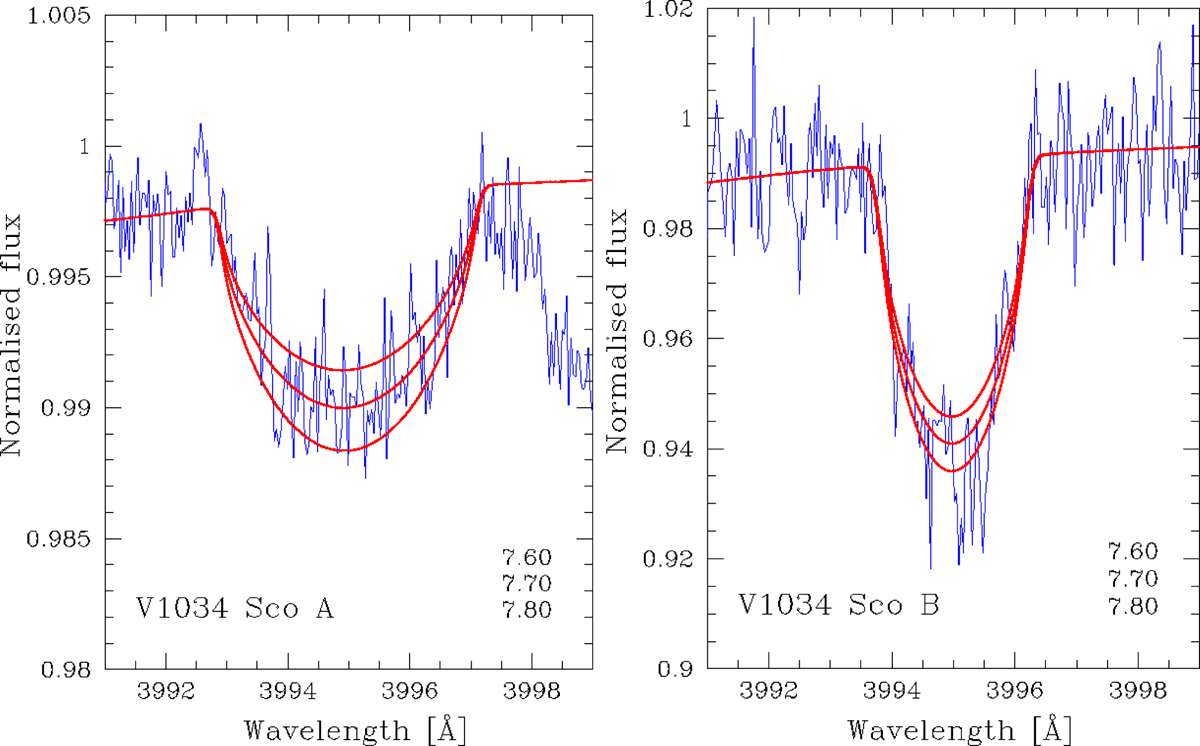
Fig. 4.
Download original image
Example of fits to N lines for our target stars. In this case, the N II 3995 Å line is shown for V1034 Sco (primary star on the left, secondary star on the right). The blue lines show the re-normalised disentangled spectra of the stars. The red lines show synthetic spectra from our pre-calculated grid for three different abundances (labelled in the bottom-right corner in each panel).
Current usage metrics show cumulative count of Article Views (full-text article views including HTML views, PDF and ePub downloads, according to the available data) and Abstracts Views on Vision4Press platform.
Data correspond to usage on the plateform after 2015. The current usage metrics is available 48-96 hours after online publication and is updated daily on week days.
Initial download of the metrics may take a while.