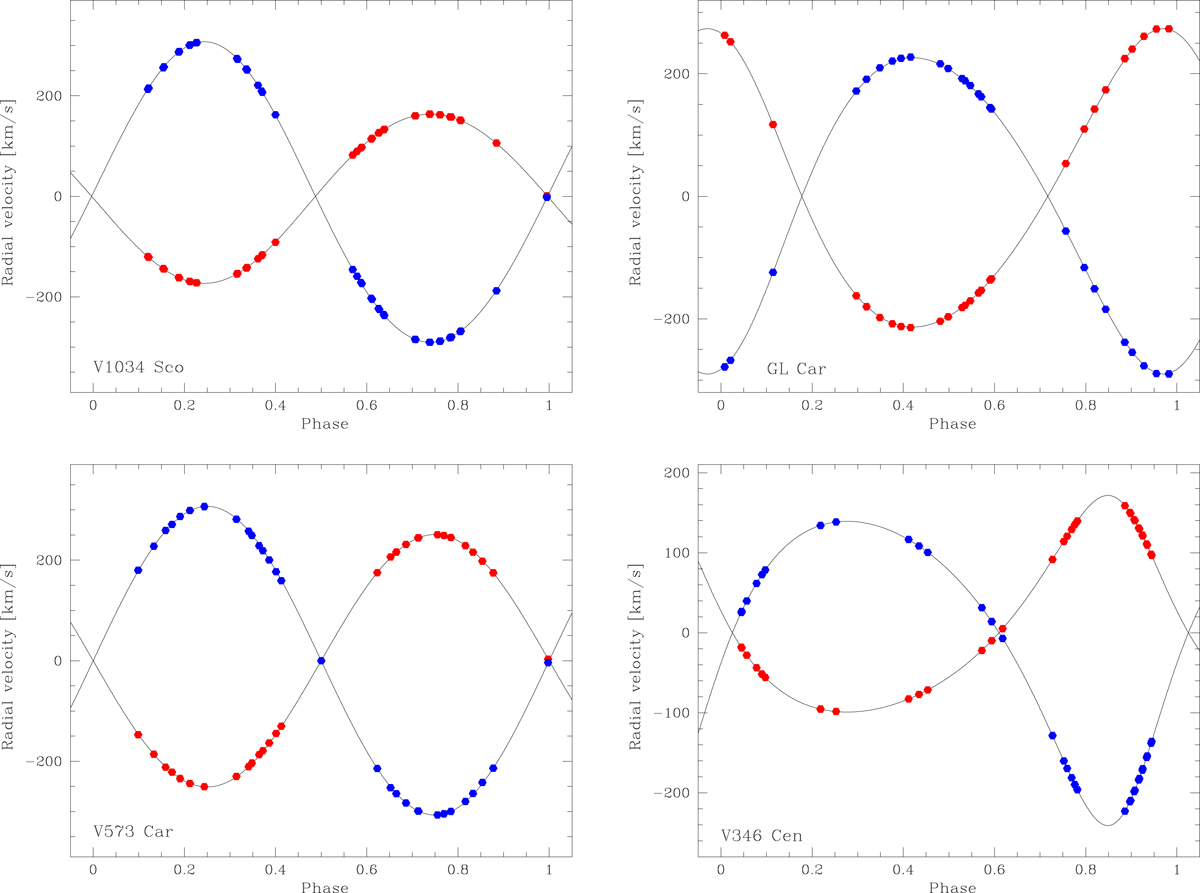
Fig. 2.
Download original image
Visualisation of the spectroscopic orbits of our targets. The best-fitting orbits are shown with black lines. The RVs of the stars at the times of observation are shown with red symbols for the primary component and blue symbols for the secondary component. Note that these are not measured RVs, and hence the uncertainties in RVs are not assigned to individual symbols, because we calculated orbital parameters directly from all observed spectra for each system (see Sect. 4).
Current usage metrics show cumulative count of Article Views (full-text article views including HTML views, PDF and ePub downloads, according to the available data) and Abstracts Views on Vision4Press platform.
Data correspond to usage on the plateform after 2015. The current usage metrics is available 48-96 hours after online publication and is updated daily on week days.
Initial download of the metrics may take a while.