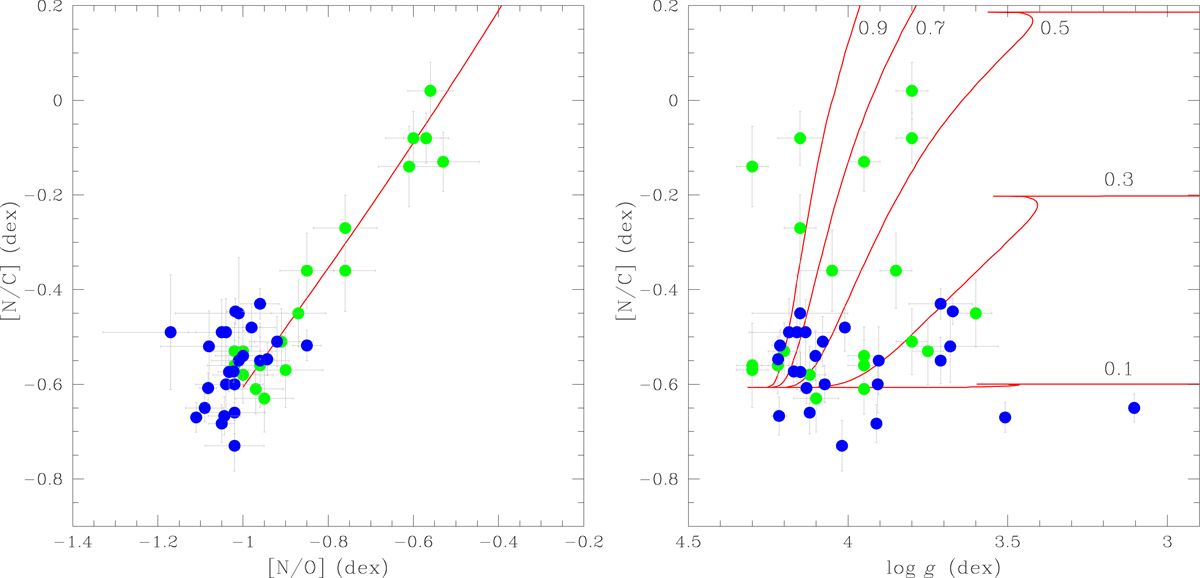
Fig. 16.
Download original image
Observed CNO abundances for binary and single high-mass stars compared to theoretical evolutionary models. Left panel: abundances of the CNO elements for high-mass stars in a diagram of [N/C] index versus [N/O] index. Stars in binary systems (Sect. 6) are represented by solid blue circles. For comparison, abundance determinations for single early-B type stars (Nieva & Przybilla 2012) are represented by green circles. Single stars obey a trend indicated by an analytical approximation to the nuclear reactions path for the CNO cycle derived in Przybilla et al. (2010) and Maeder et al. (2014). The slope in this diagram indicates a gradual enhancement of N at the expense of C. A slight decrease in the O abundance is also predicted. Whilst the single and binary stars span almost identical mass and Teff ranges, and are all MS stars, it is clear they do not share the same distribution (see Sect. 9). Right panel: Observed [N/C] index for 25 high-mass stars in binaries (solid blue circles) compared to single B-type stars (solid green circles; Nieva & Przybilla 2012) as a function of surface gravity. Solid red lines in the right panel show theoretical evolutionary tracks for a 15 M⊙ star and five values of the initial rotational velocity, Ω/Ωcrit = 0.1, 0.3, 0.5, 0.7, and 0.9 (Georgy et al. 2013). Striking differences between single stars and stars in binary systems are discussed in Sect. 9.
Current usage metrics show cumulative count of Article Views (full-text article views including HTML views, PDF and ePub downloads, according to the available data) and Abstracts Views on Vision4Press platform.
Data correspond to usage on the plateform after 2015. The current usage metrics is available 48-96 hours after online publication and is updated daily on week days.
Initial download of the metrics may take a while.