Fig. 14.
Download original image
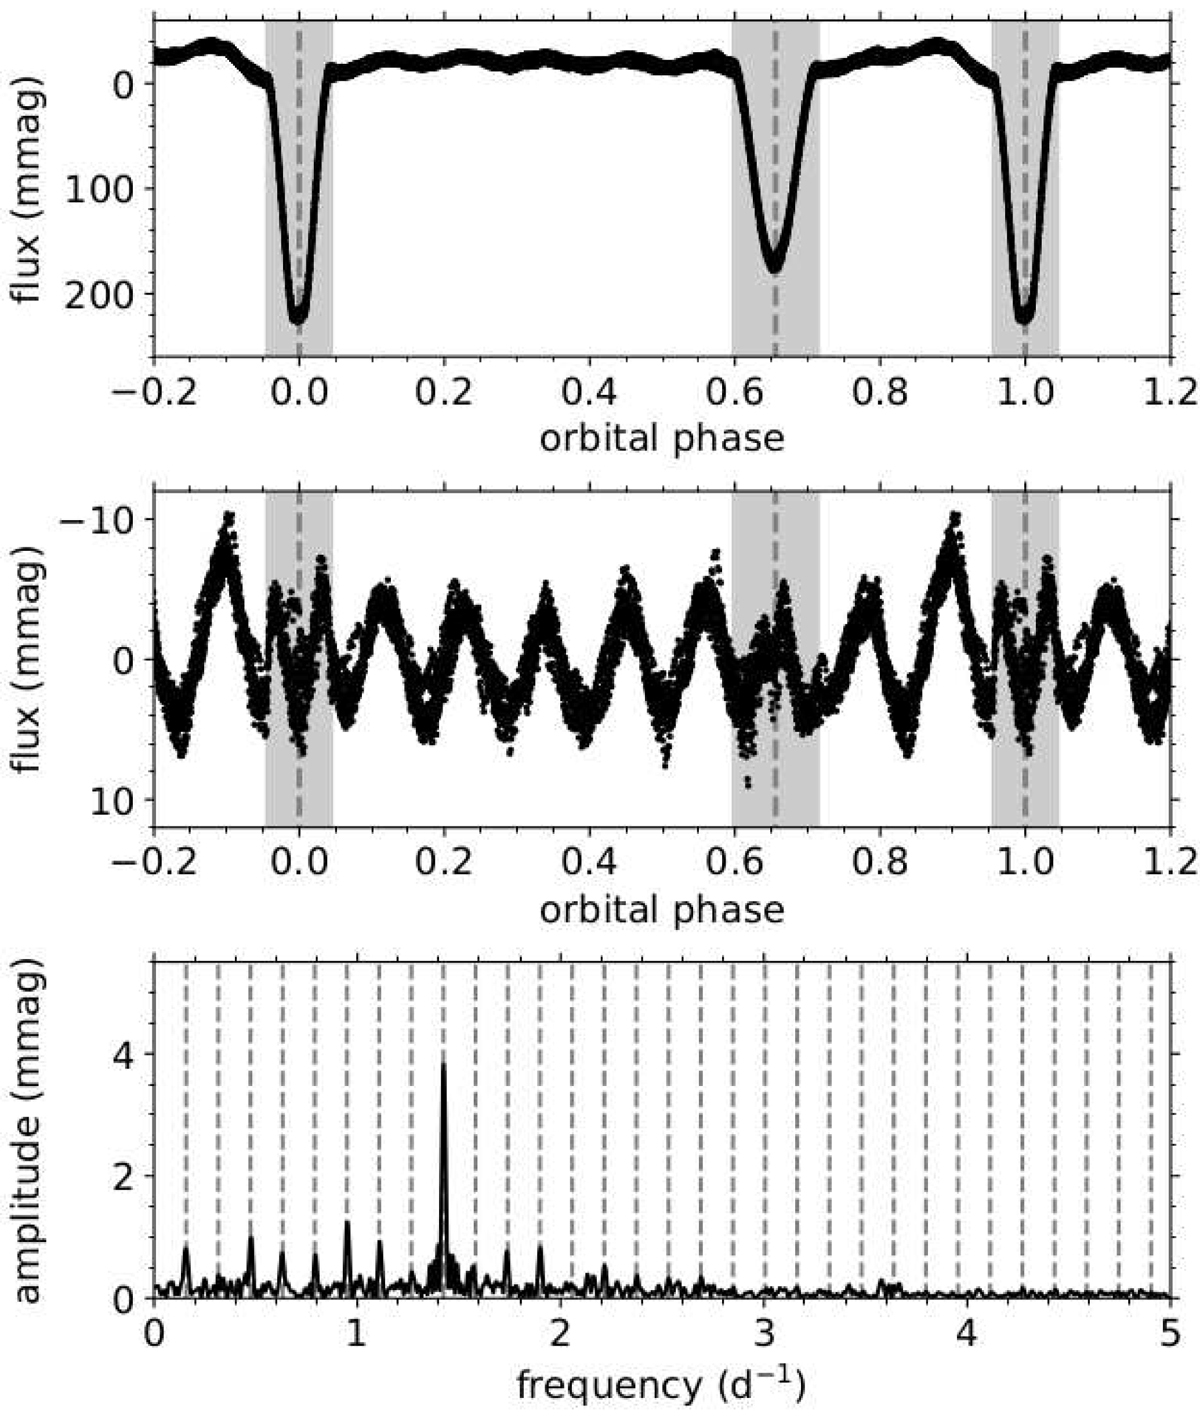
Tidally excited pulsations of V346 Cen. Top: observed light curve of V346 Cen for sectors 37 and 38, phase-folded with the binary orbital period. The eclipses are indicated by the grey bands. Middle: pulsation light curve of V346 Cen for sectors 37 and 38, phase-folded with the binary orbital period. Data points taken during the eclipses again lie within the grey bands. Bottom: Lomb–Scargle periodogram, calculated for the out-of-eclipse data points of the pulsation light curve for sectors 37 and 38. The vertical dashed lines indicate harmonics of the orbital frequency.
Current usage metrics show cumulative count of Article Views (full-text article views including HTML views, PDF and ePub downloads, according to the available data) and Abstracts Views on Vision4Press platform.
Data correspond to usage on the plateform after 2015. The current usage metrics is available 48-96 hours after online publication and is updated daily on week days.
Initial download of the metrics may take a while.