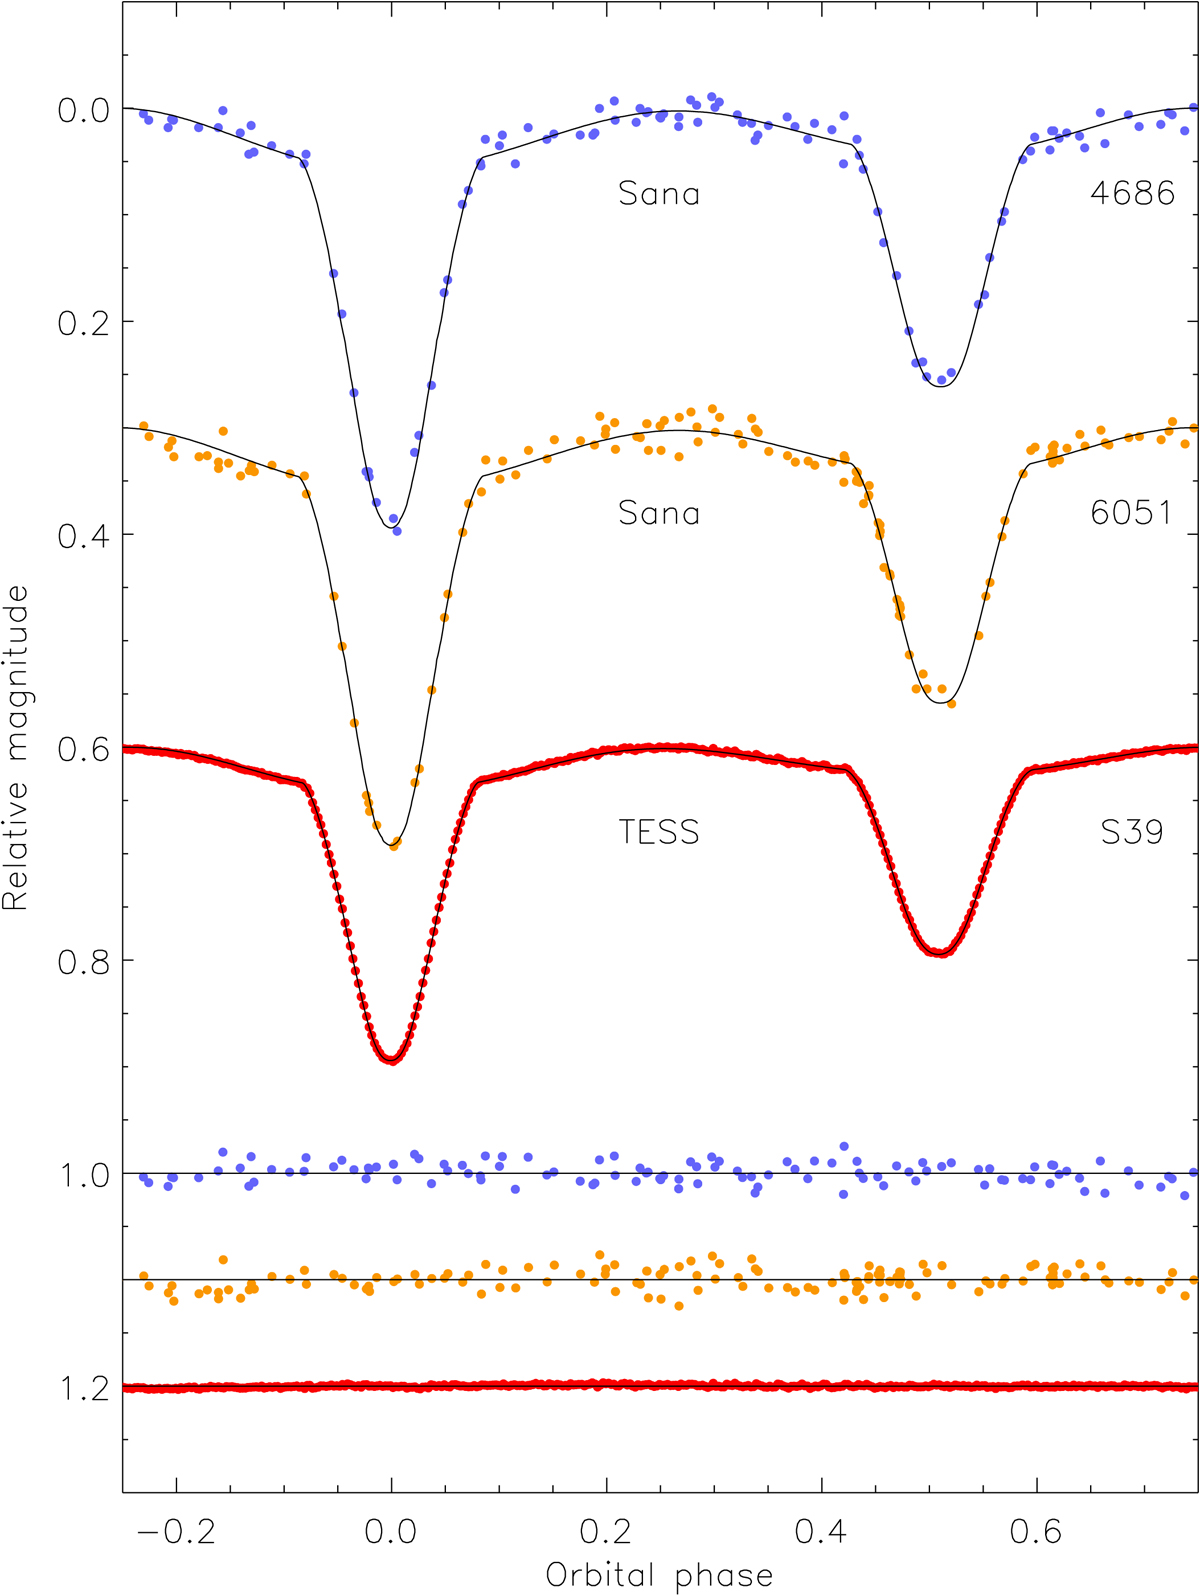
Fig. 10.
Download original image
Light curves and best WD models for V1034 Sco. The differential magnitudes are plotted vs. orbital phase and are colour-coded according to the central wavelengths of the passbands. The source and passband of each light curve is labelled. The residuals of the fit are shown at the base of the figure. Offsets have been applied between the light curves and residuals for clarity.
Current usage metrics show cumulative count of Article Views (full-text article views including HTML views, PDF and ePub downloads, according to the available data) and Abstracts Views on Vision4Press platform.
Data correspond to usage on the plateform after 2015. The current usage metrics is available 48-96 hours after online publication and is updated daily on week days.
Initial download of the metrics may take a while.