Fig. 7.
Download original image
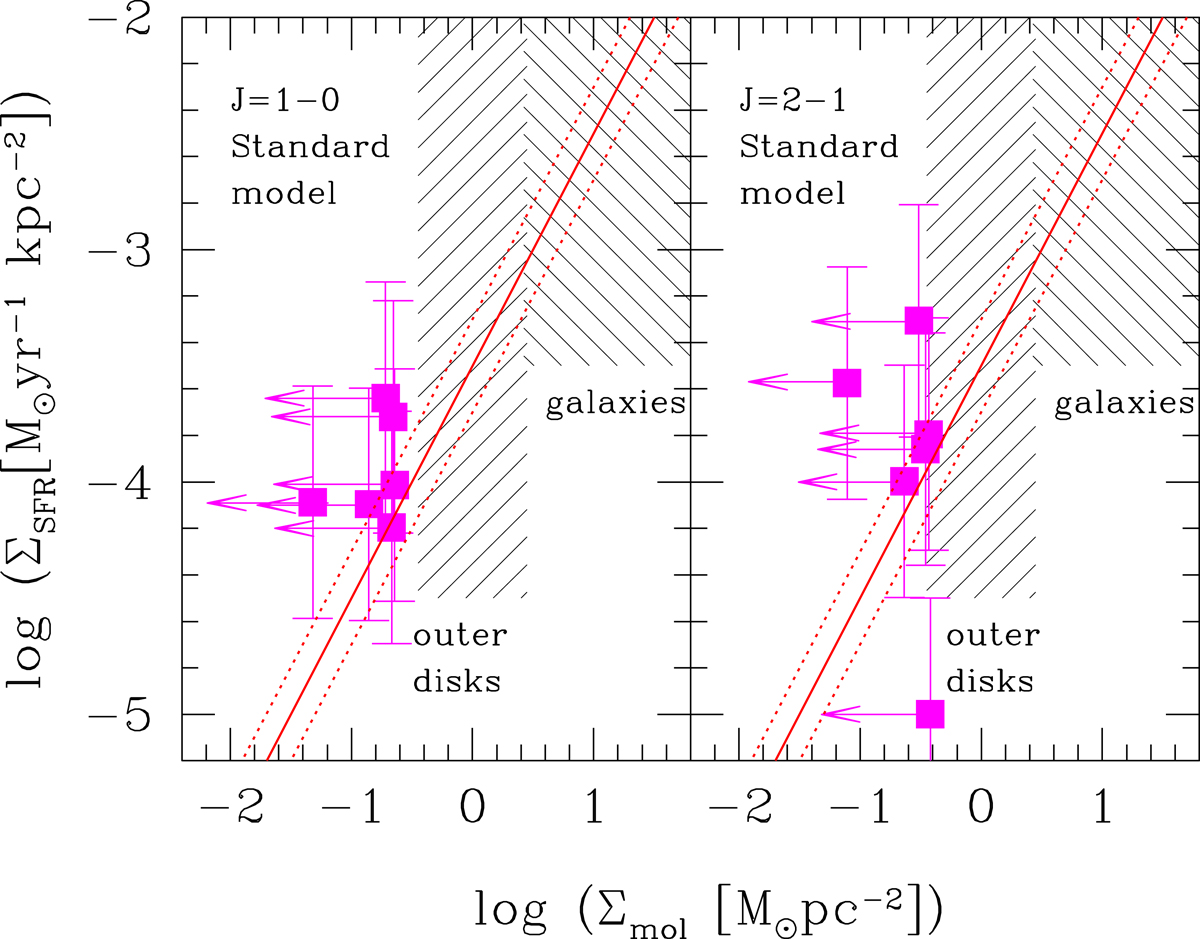
K–S diagram relating star formation rates to molecular gas surface densities. The upper limits to the average molecular mass surface densities in the IRAM beams for six star-forming regions observed in the Leo ring are shown with magenta square symbols. The standard cloud model for the expected FWHM of the lines has been used. The continuum and dotted lines show the K–S relation and its dispersion, as fitted by Leroy et al. (2013) to the inner disk data of galaxies. The shaded areas indicate the molecular gas surface densities typical of the inner regions of galaxies and of outer disks (see Watson et al. 2016).
Current usage metrics show cumulative count of Article Views (full-text article views including HTML views, PDF and ePub downloads, according to the available data) and Abstracts Views on Vision4Press platform.
Data correspond to usage on the plateform after 2015. The current usage metrics is available 48-96 hours after online publication and is updated daily on week days.
Initial download of the metrics may take a while.