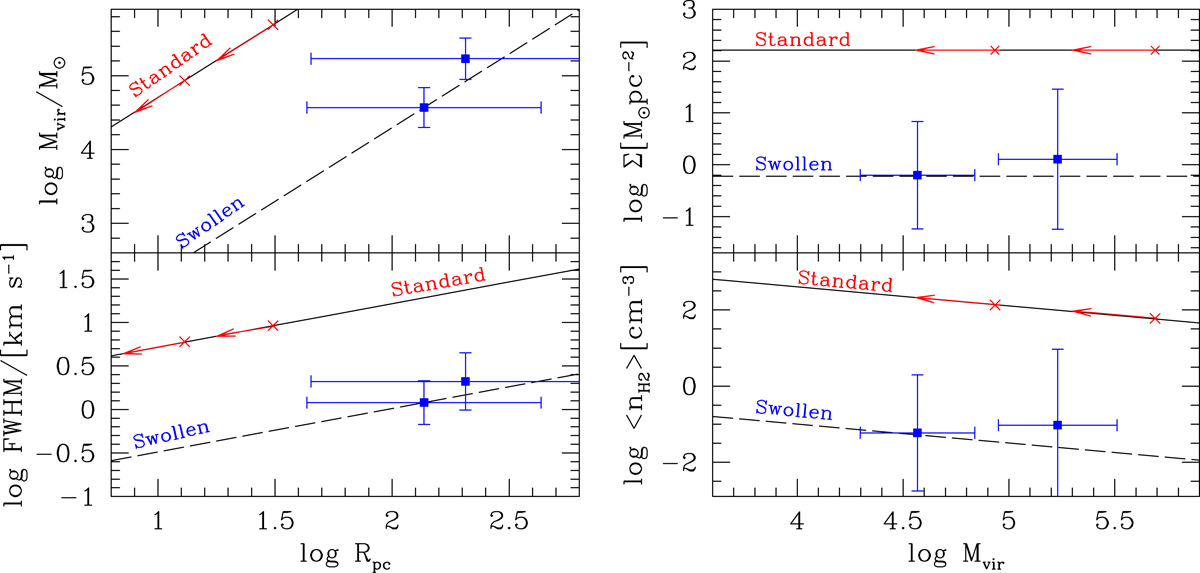
Fig. 6.
Download original image
Predicted relations between cloud parameters for the swollen and the standard cloud model. Left panels: cloud viral radius in relation to the line FWHM (bottom panel) and to the cloud viral mass (upper panel) according to the standard cloud model. The long dashed line is for the swollen model, which reproduces the tentative detections. Right panels: cloud viral mass in relation to the average volume density (bottom panel) and mass surface density (upper panel) for the standard and the swollen model. The tentative detections for C1a and C1b are shown as blue triangles for the swollen mode in each panel. For the standard model we only have upper limits which are shown by cross symbols with red arrows.
Current usage metrics show cumulative count of Article Views (full-text article views including HTML views, PDF and ePub downloads, according to the available data) and Abstracts Views on Vision4Press platform.
Data correspond to usage on the plateform after 2015. The current usage metrics is available 48-96 hours after online publication and is updated daily on week days.
Initial download of the metrics may take a while.