Fig. 5.
Download original image
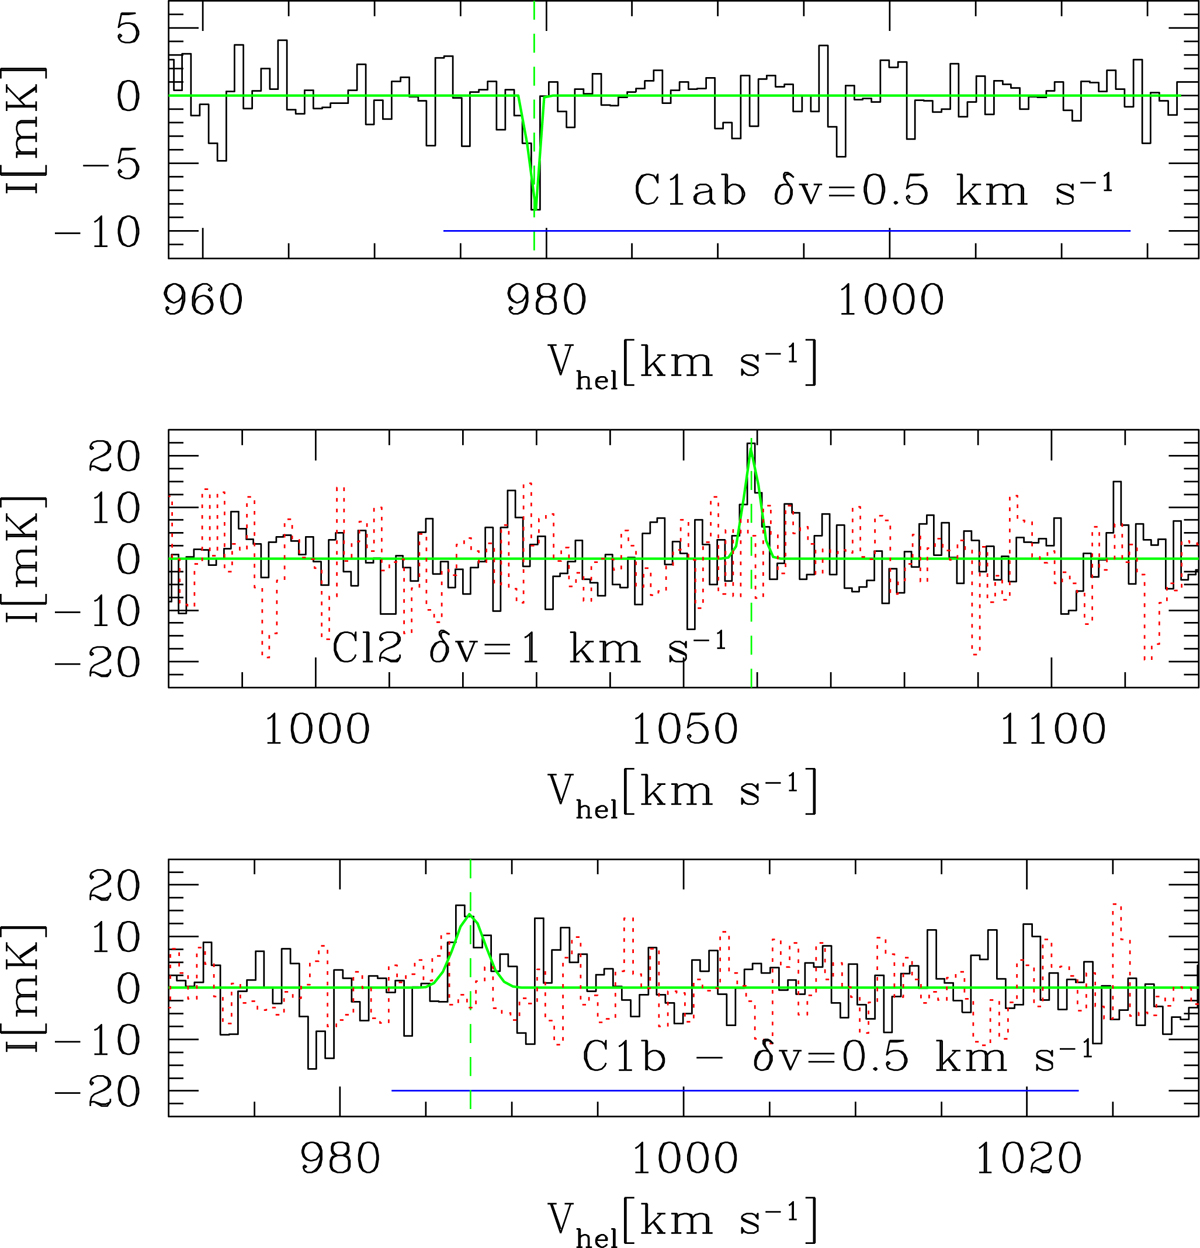
Spectra of CO J = 1–0 at the positions of C1b (bottom) and Cl2 (middle) for 0.5 and 1 km s−1 channel width. The green lines show Gaussian fits to marginal detections with the highest integrated signal-to-noise emission. The velocities of the Gaussian peaks are indicated by green vertical dashed lines. The red dotted line shows the corresponding J = 2–1 spectra. The horizontal blue lines at the bottom of each panel indicate the expected velocity range (the Cl2 line is offset by more than 20 km s−1 from the velocity of the HI peak). The top panel shows the CO J = 1–0 stacked spectra of four adjacent positions in Clump1 (C1a, C1b, C1an, C1se). The Gaussian fit to the narrow negative dip (see text) is shown by the continuous green line.
Current usage metrics show cumulative count of Article Views (full-text article views including HTML views, PDF and ePub downloads, according to the available data) and Abstracts Views on Vision4Press platform.
Data correspond to usage on the plateform after 2015. The current usage metrics is available 48-96 hours after online publication and is updated daily on week days.
Initial download of the metrics may take a while.