Fig. 4.
Download original image
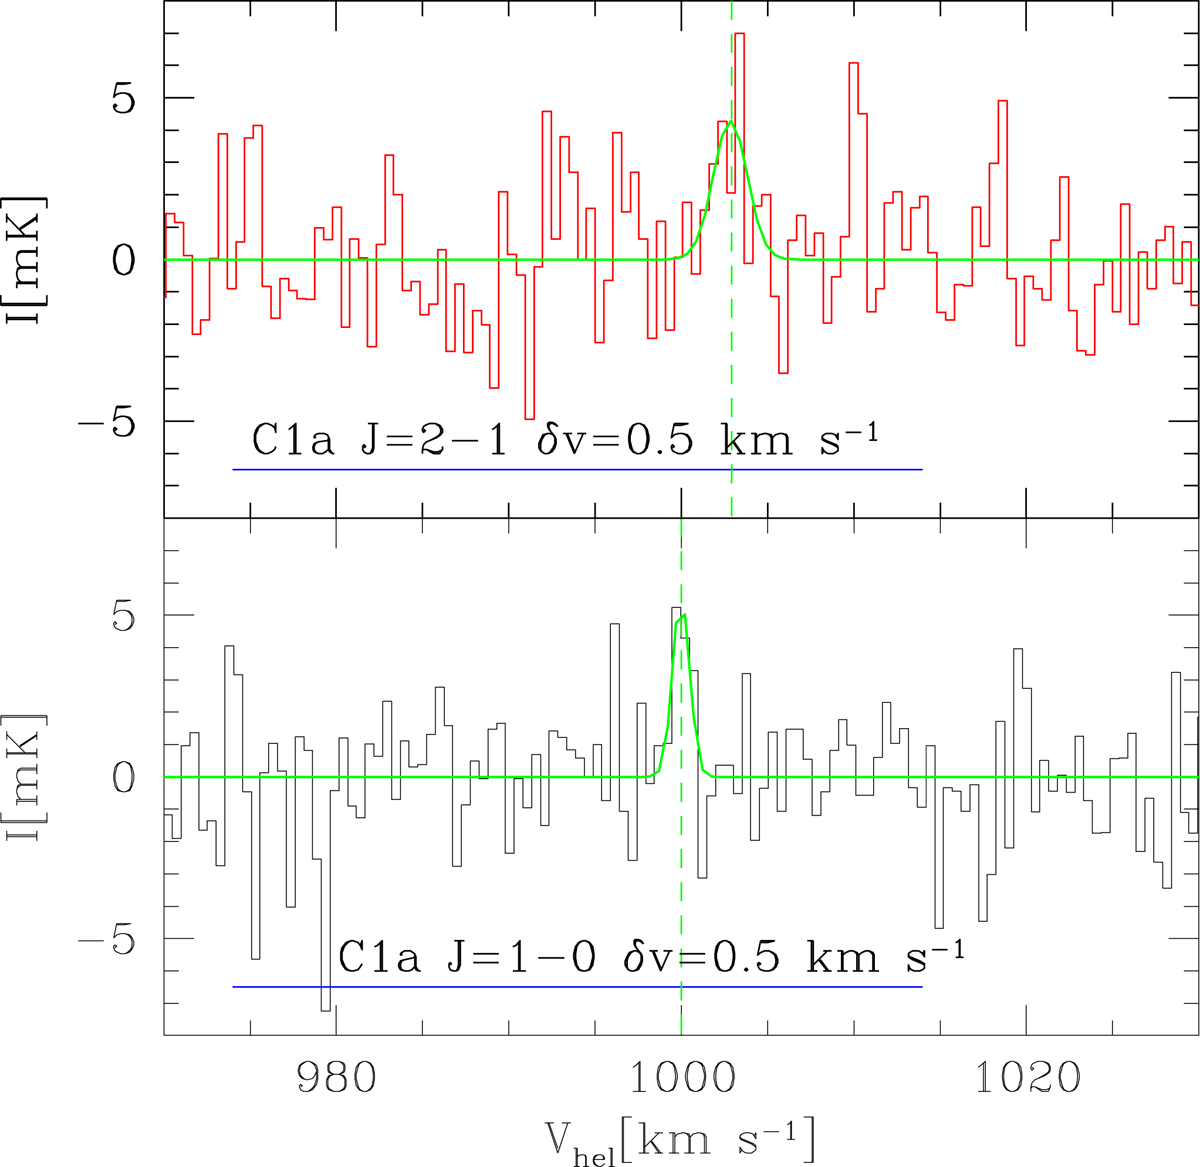
Spectra of CO J = 1–0 (bottom) and J = 2–1 (top) at the position C1a for a spectral resolution of 0.5 km s−1. Gaussian fits to lines marginally detected with the highest integrated signal-to-noise emission are shown as a green line. The velocities of the Gaussian peaks are indicated by green vertical dashed lines. The horizontal blue lines at the bottom of each panel indicate the expected velocity range (as given by the C1a Hα line velocity ±20 km s−1).
Current usage metrics show cumulative count of Article Views (full-text article views including HTML views, PDF and ePub downloads, according to the available data) and Abstracts Views on Vision4Press platform.
Data correspond to usage on the plateform after 2015. The current usage metrics is available 48-96 hours after online publication and is updated daily on week days.
Initial download of the metrics may take a while.