Fig. 2.
Download original image
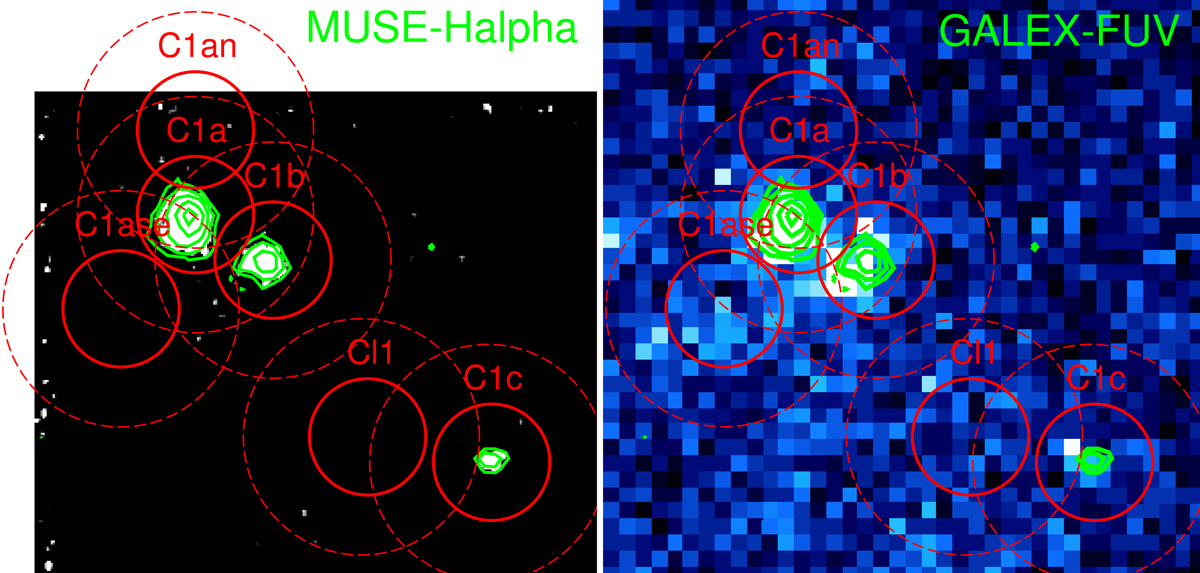
Contours of the Hα emission of the three ionized regions in Clump1 (C1a, C1b, and C1c) overlaid (in green) on the MUSE-Hα image (left panel) and on the GALEX-FUV continuum image (right panel). The contour levels are 1.3, 2.5, 5, 10, 15×10−20 erg s−1 cm−2 per pixel (0.2″). The red continuous lines indicate the size of the 230 GHz beam FWHM at the locations observed in Clump1 with the IRAM-30 m telescope. The dashed red lines show the corresponding FWHM of the 115 GHz beam. The observed position labels are placed just outside the continuous red line circles.
Current usage metrics show cumulative count of Article Views (full-text article views including HTML views, PDF and ePub downloads, according to the available data) and Abstracts Views on Vision4Press platform.
Data correspond to usage on the plateform after 2015. The current usage metrics is available 48-96 hours after online publication and is updated daily on week days.
Initial download of the metrics may take a while.