Open Access
Fig. 4
Download original image
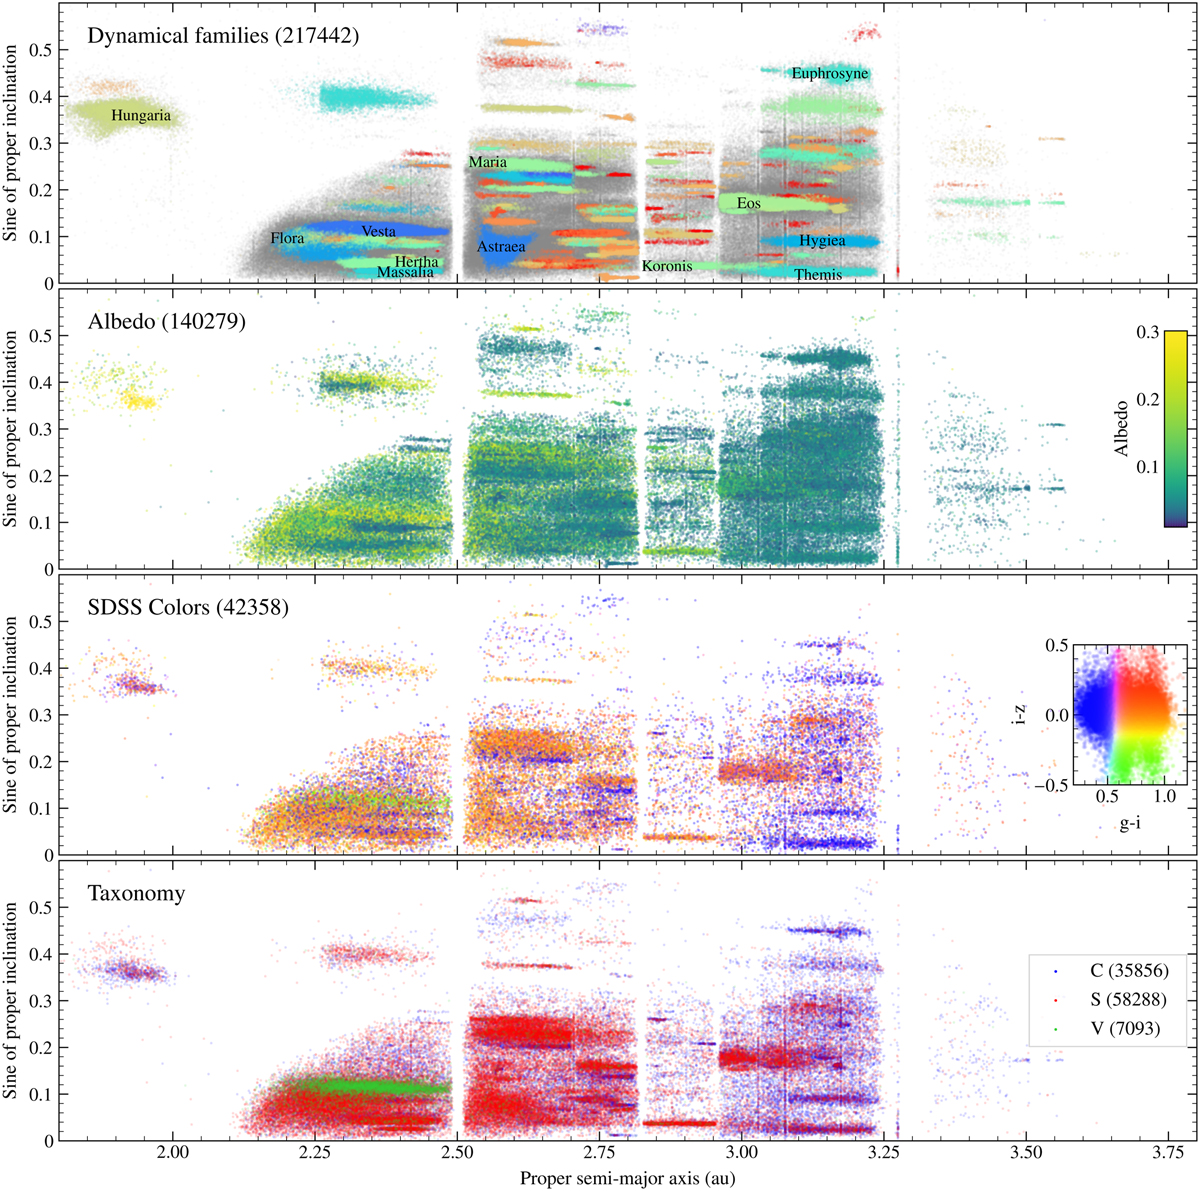
Distribution of families (first panel), albedo (second), colors (third, using a color-scheme similar to Parker et al. 2008 based on a code by Ivezic et al. 2014), and taxonomy (fourth) against proper elements (semi-major axis and sine of inclination). The number of plotted objects is reported in each panel.
Current usage metrics show cumulative count of Article Views (full-text article views including HTML views, PDF and ePub downloads, according to the available data) and Abstracts Views on Vision4Press platform.
Data correspond to usage on the plateform after 2015. The current usage metrics is available 48-96 hours after online publication and is updated daily on week days.
Initial download of the metrics may take a while.