Fig. 5.
Download original image
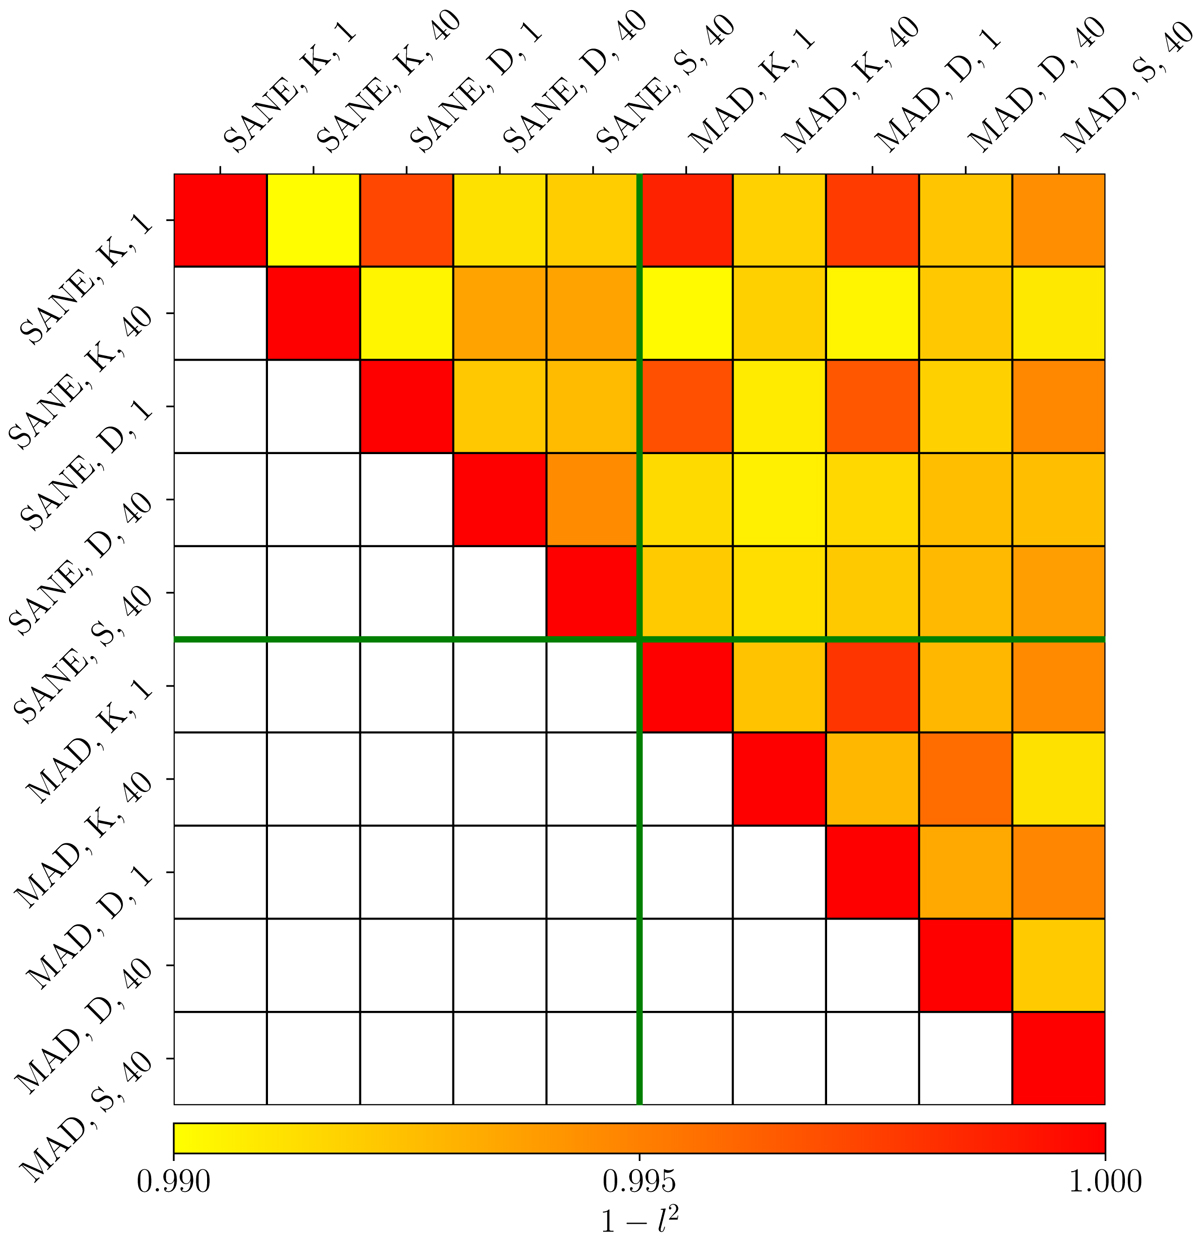
L2 norm of the pixel-by-pixel differences between images of given models. The upper left and lower right quadrants show comparisons of spacetime-Rhigh combinations in SANE and MAD, respectively. The upper right quadrant shows comparisons also for different accretion models. The labels are abbreviated as “K”: Kerr, “D”: dilaton, “S”: Schwarzschild, and Rhigh = 1, 40.
Current usage metrics show cumulative count of Article Views (full-text article views including HTML views, PDF and ePub downloads, according to the available data) and Abstracts Views on Vision4Press platform.
Data correspond to usage on the plateform after 2015. The current usage metrics is available 48-96 hours after online publication and is updated daily on week days.
Initial download of the metrics may take a while.