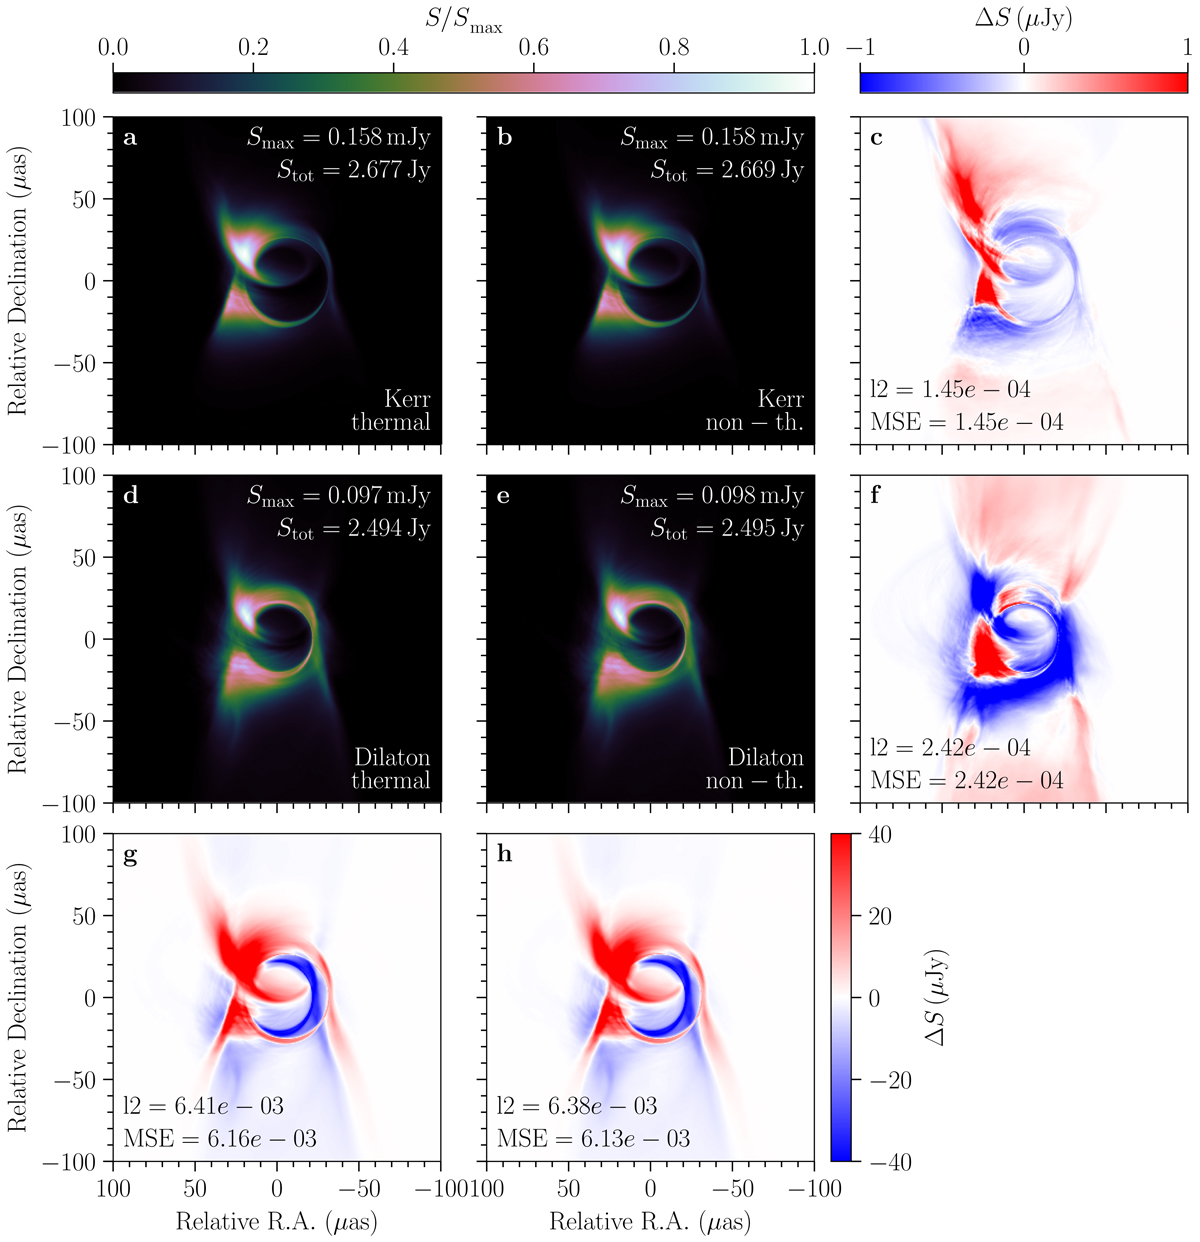
Fig. 3.
Download original image
Kerr and dilaton GRRT images at Rhigh = 40 in the SANE simulation. The images are averages of 100 snapshots over 1000 M simulation time (∼6 h for Sgr A*). This model configuration shows the largest difference between different electron distribution (eDF) functions (panel f) in the Dilaton spacetime in the given parameter space. The bottom row shows pixel-by-pixel differences between the two spacetimes at a given eDF.
Current usage metrics show cumulative count of Article Views (full-text article views including HTML views, PDF and ePub downloads, according to the available data) and Abstracts Views on Vision4Press platform.
Data correspond to usage on the plateform after 2015. The current usage metrics is available 48-96 hours after online publication and is updated daily on week days.
Initial download of the metrics may take a while.