Fig. 8
Download original image
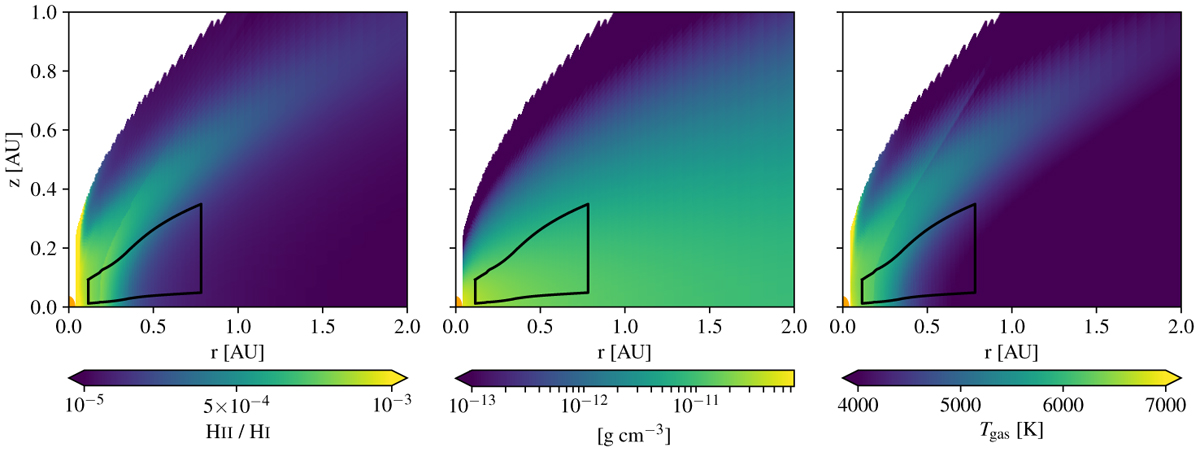
Hydrogen ionization, density, and temperature structure of the inner region of B243. The parameters used match the values indicated by the full red line in Fig. 5. The black contour indicates the approximate origin of 50% of the Pa-16 line emission based on vertical escape probabilities. The orange circle on the left indicates the central object.
Current usage metrics show cumulative count of Article Views (full-text article views including HTML views, PDF and ePub downloads, according to the available data) and Abstracts Views on Vision4Press platform.
Data correspond to usage on the plateform after 2015. The current usage metrics is available 48-96 hours after online publication and is updated daily on week days.
Initial download of the metrics may take a while.