Fig. 4
Download original image
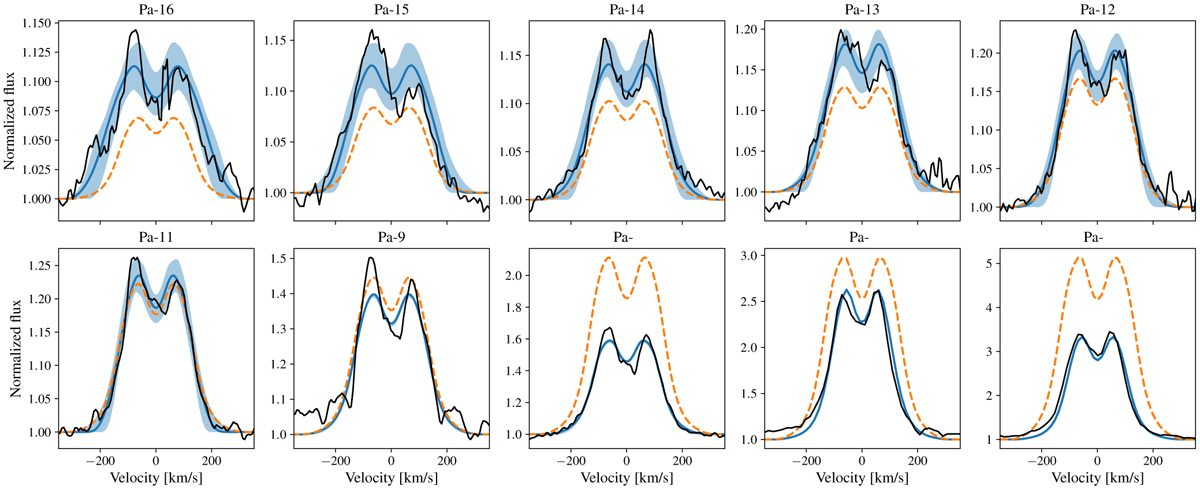
Best fitting models in blue to the observed lines in black for B243. The blue shaded regions indicate models that fall within the 1σ confidence interval. Each line is fitted individually with the inclination set to 75°, the respective parameters are shown in Fig. 5. The orange profiles indicate the best fit when fitting Pa-16 to Pa-9 simultaneously. Notice the factor ~30 range in line strengths covered by the Paschen series.
Current usage metrics show cumulative count of Article Views (full-text article views including HTML views, PDF and ePub downloads, according to the available data) and Abstracts Views on Vision4Press platform.
Data correspond to usage on the plateform after 2015. The current usage metrics is available 48-96 hours after online publication and is updated daily on week days.
Initial download of the metrics may take a while.