Fig. 12
Download original image
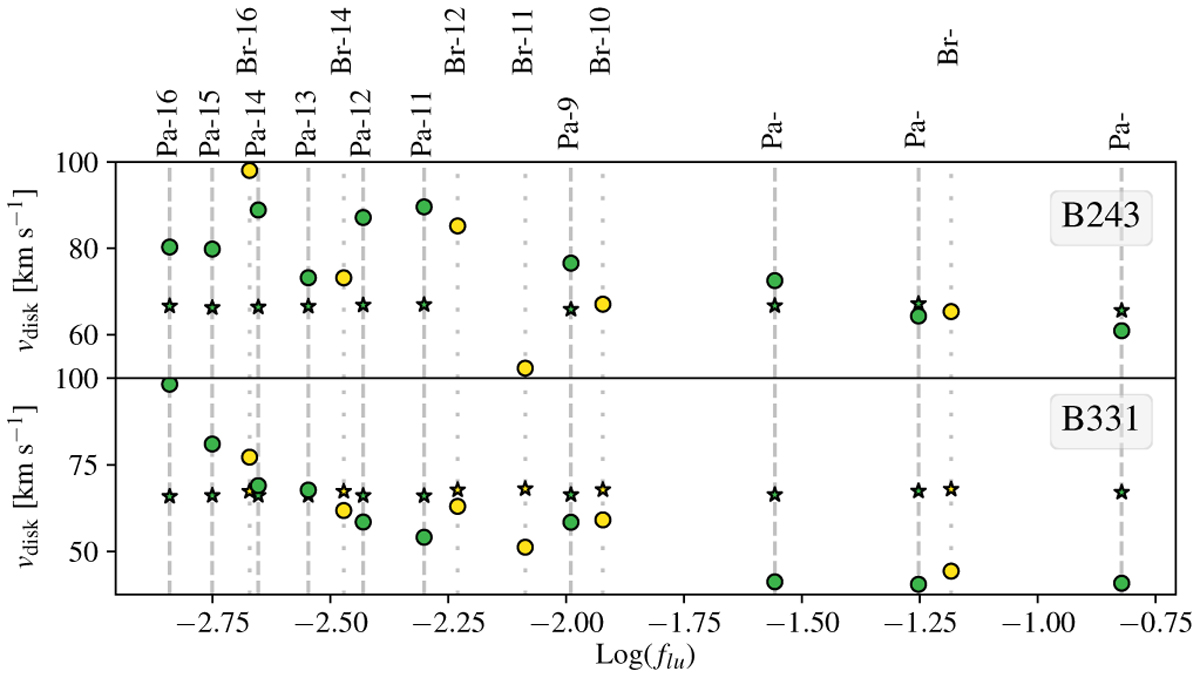
Orbital velocity of the hydrogen gas based on the peak separation of the observed (circles) and simulated (stars) emission lines as function of their oscillator strength. Green markers indicate Paschen lines and yellow markers Brackett lines. The velocity is determined by fitting double gaussians to the profile. The simulated profiles are from Figs. 4 and 7.
Current usage metrics show cumulative count of Article Views (full-text article views including HTML views, PDF and ePub downloads, according to the available data) and Abstracts Views on Vision4Press platform.
Data correspond to usage on the plateform after 2015. The current usage metrics is available 48-96 hours after online publication and is updated daily on week days.
Initial download of the metrics may take a while.