Fig. 10
Download original image
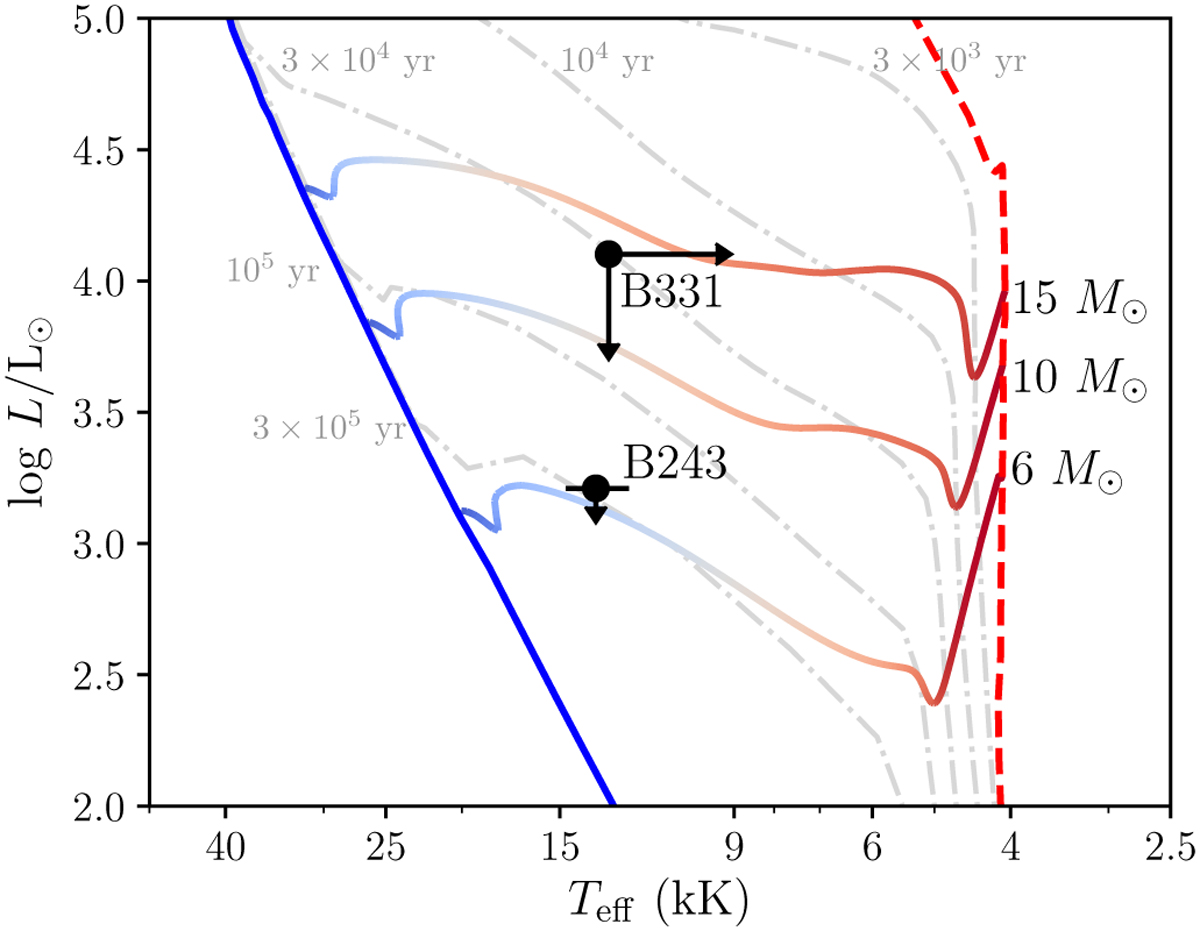
Adapted from Fig. 9 of RT17. Positions of B243 and B331 in the Hertzsprung-Russel Diagram. The solid blue line on the left indicates the zero age main sequence. The dashed red line on the right indicates the birth line. The solid line connecting the birth line and the zero age main sequence indicate the MIST pre-main sequence evolutionary tracks of stars with masses indicated on the right (Dotter 2016). The colour of this line indicates the relative time between birth and reaching the main sequence. The dash dotted grey lines indicate the isochrones corresponding to 3 × 10³, 104, 3 × 10⁴, 105 and 3 × 10⁵ yr from top to bottom respectively.
Current usage metrics show cumulative count of Article Views (full-text article views including HTML views, PDF and ePub downloads, according to the available data) and Abstracts Views on Vision4Press platform.
Data correspond to usage on the plateform after 2015. The current usage metrics is available 48-96 hours after online publication and is updated daily on week days.
Initial download of the metrics may take a while.