Fig. 1
Download original image
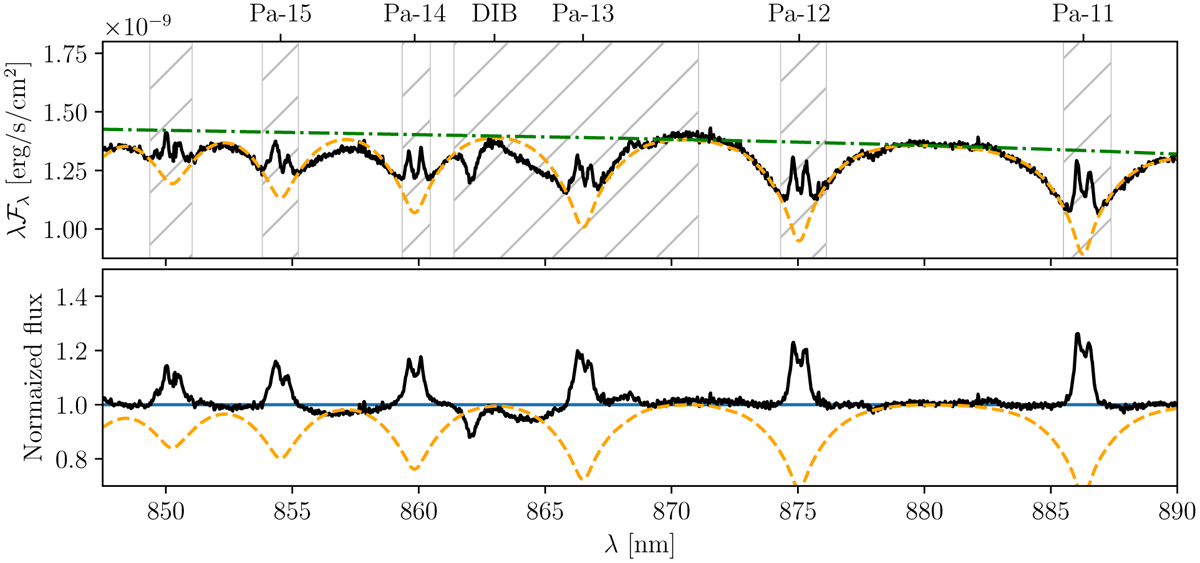
Illustration of the normalization method. Top panel: the flux calibrated observed spectrum of B243 in black. The photospheric model spectrum is indicated by the orange dashed line and the continuum of this model by the green dash-dotted line. The model spectrum is matched to the observed spectrum using a least squares method in the unhatched wavelength ranges. At the top the location of the Paschen lines and a DIB are indicated. Bottom panel: the photosphere corrected and normalized observed spectrum (in solid black) and photospheric model (in dashed blue). The horizontal blue line indicates unity.
Current usage metrics show cumulative count of Article Views (full-text article views including HTML views, PDF and ePub downloads, according to the available data) and Abstracts Views on Vision4Press platform.
Data correspond to usage on the plateform after 2015. The current usage metrics is available 48-96 hours after online publication and is updated daily on week days.
Initial download of the metrics may take a while.