Fig. 8
Download original image
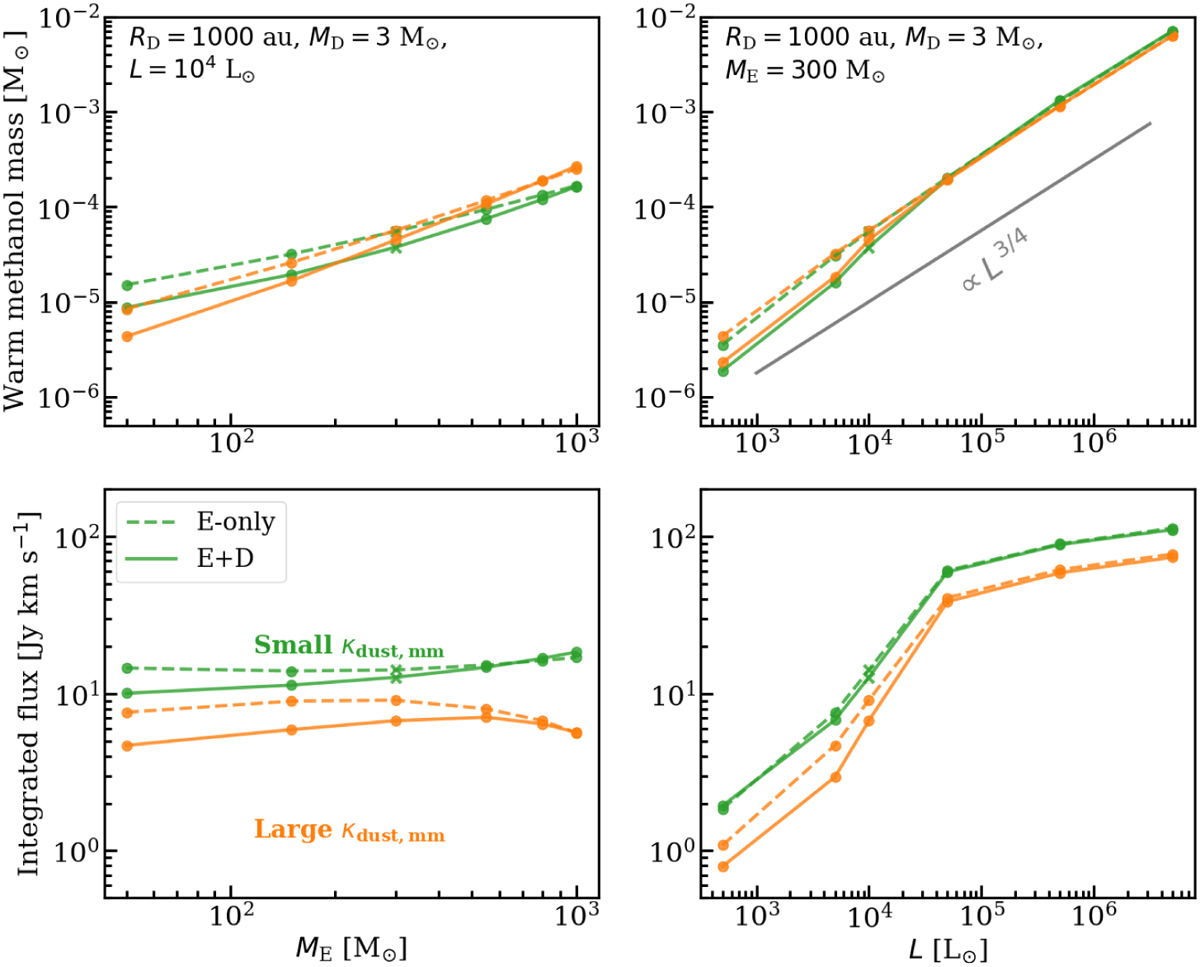
Warm methanol mass (top row) and integrated line fluxes (bottom row) for various models. The left column presents the models with varying envelope masses but constant luminosity of 104 L⊙ (i.e., varying accretion rates for the envelope-plus-disk models). The right column shows the models with varying bolometric luminosity but constant envelope mass of 300 M⊙ (i.e., constant accretion rate of 2 × 10⁻³ M⊙ yr−1). The parameters that were fixed for each column are printed in the top row plots. For example, where the envelope mass was varied, the disk radius was fixed to 1000 au, the disk mass was fixed to 3 M⊙, and the luminosity was fixed to 104 L⊙. Orange and green show the models with high and low mm opacity dust. The fiducial models are indicated by a cross. Solid and dashed lines present the envelope-plus-disk and envelope-only models, respectively. The solid gray line in the top right panel shows the analytical relation of warm methanol mass and luminosity, which goes as ∝L3/4 (Van Gelder et al. 2022b). This relation is normalized by an arbitrary value here, hence, only its slope should be compared with the models. The integrated line fluxes were calculated after the lines were continuum subtracted, and a source distance of 4 kpc was assumed.
Current usage metrics show cumulative count of Article Views (full-text article views including HTML views, PDF and ePub downloads, according to the available data) and Abstracts Views on Vision4Press platform.
Data correspond to usage on the plateform after 2015. The current usage metrics is available 48-96 hours after online publication and is updated daily on week days.
Initial download of the metrics may take a while.