Open Access
Fig. 7
Download original image
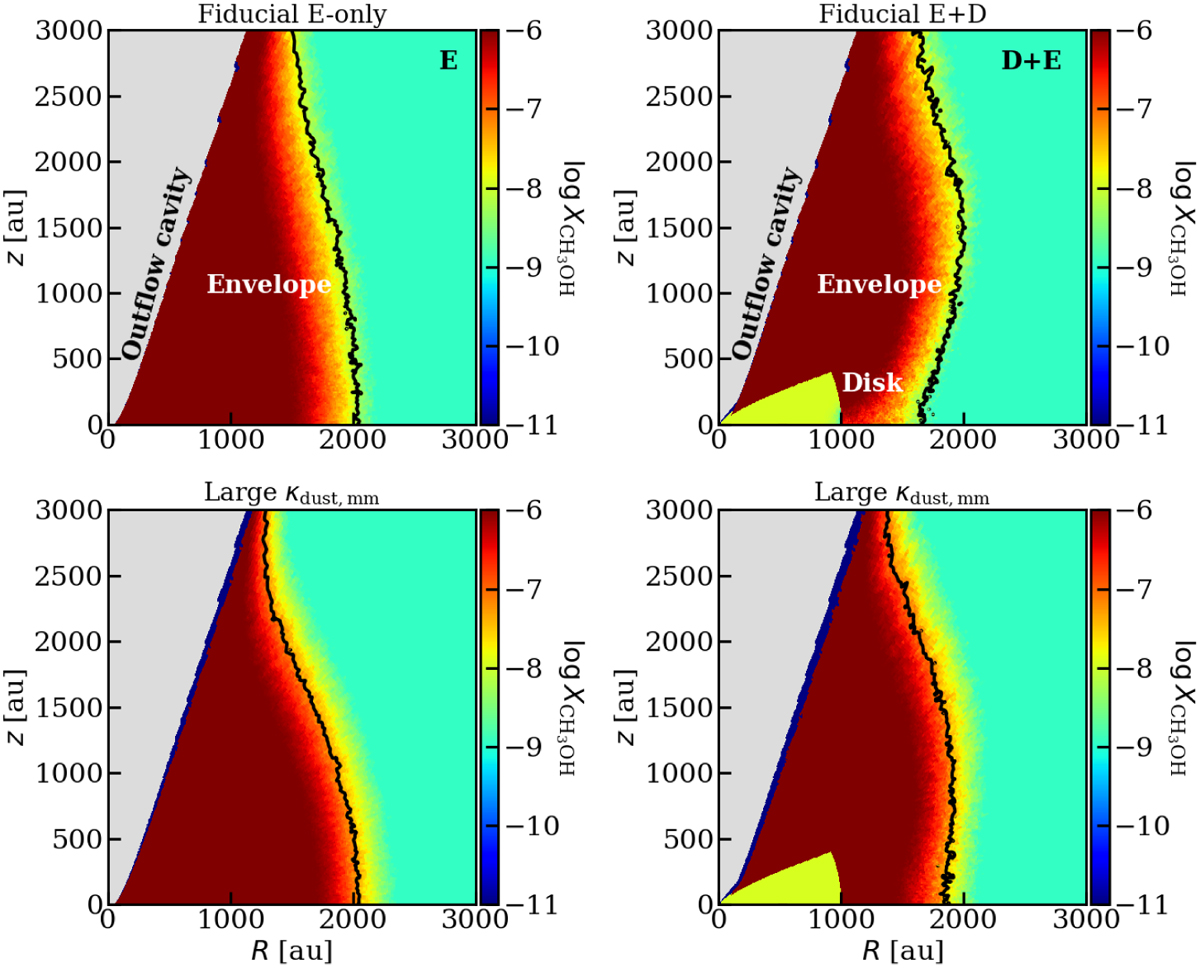
Gas-phase methanol abundance map for the fiducial envelope-only and envelope-plus disk models (top row) and those with high mm opacity dust (bottom row). The black contours show the 68 K lines at which methanol starts to be sublimated from the grains at the densities of these models.
Current usage metrics show cumulative count of Article Views (full-text article views including HTML views, PDF and ePub downloads, according to the available data) and Abstracts Views on Vision4Press platform.
Data correspond to usage on the plateform after 2015. The current usage metrics is available 48-96 hours after online publication and is updated daily on week days.
Initial download of the metrics may take a while.