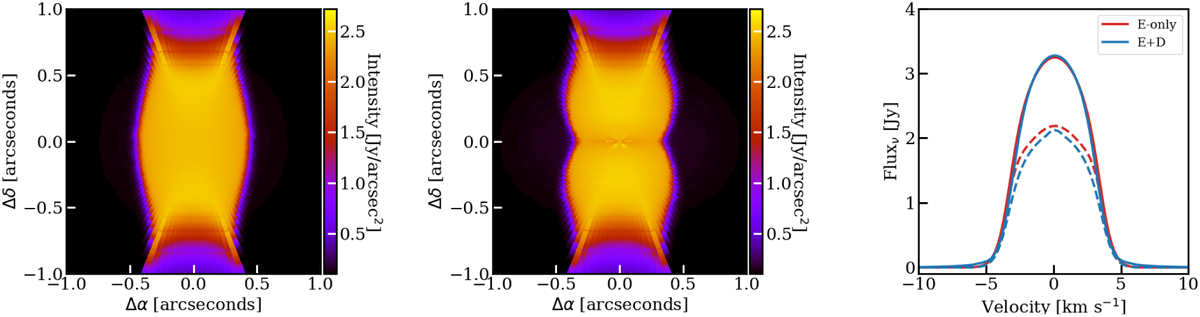
Fig. B.2
Download original image
Methanol emission from the fiducial envelope-only and envelope-plus-disk models. The left and middle panels show the emission at the peak of the line viewed edge-on for the two models without dust in these two particular models, so that the methanol emission can be seen without optical depth effects from the dust (dust is included in all other models, unless otherwise stated). The right panel shows the continuum-subtracted line flux at an assumed source distance of 4 kpc when viewed edge-on (solid lines) and face-on (dashed lines).
Current usage metrics show cumulative count of Article Views (full-text article views including HTML views, PDF and ePub downloads, according to the available data) and Abstracts Views on Vision4Press platform.
Data correspond to usage on the plateform after 2015. The current usage metrics is available 48-96 hours after online publication and is updated daily on week days.
Initial download of the metrics may take a while.