Fig. 11
Download original image
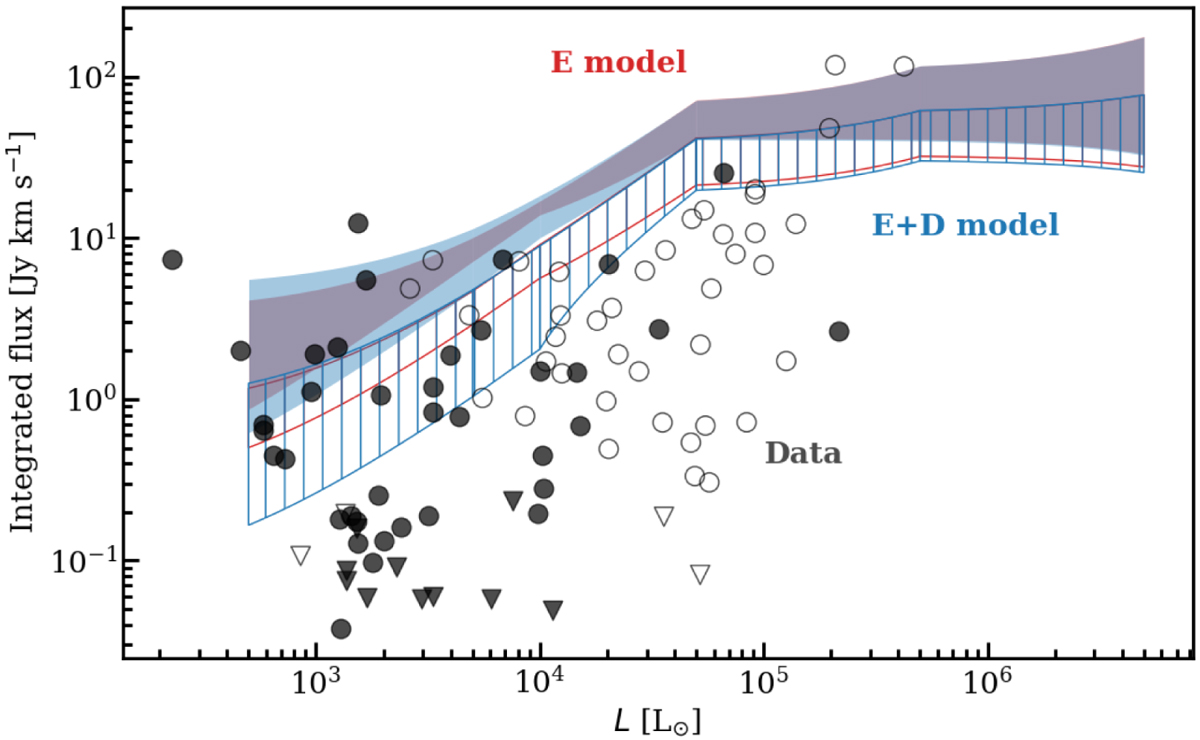
Comparison of models with observations of ALMAGAL sources. The same methanol line is used for the models and observations. Moreover, the integrated fluxes from the observations are normalized to a distance of 4 kpc to match those from the models. The black data points present the observations, where the circles are detections and triangles are upper limits. The empty symbols indicate sources whose L/M from Elia et al. (2017) is above 22.4 L⊙ M⊙−1, proposed to be ‘HII region candidates’. The smooth red and blue regions show the results from the envelope-only and envelope-plus-disk models with low mm opacity dust grains. The striped regions show the same for models with high mm opacity dust. The regions into which the models fall (blue and red) are found by simply connecting the integrated fluxes at the six different luminosities considered in this work in linear space.
Current usage metrics show cumulative count of Article Views (full-text article views including HTML views, PDF and ePub downloads, according to the available data) and Abstracts Views on Vision4Press platform.
Data correspond to usage on the plateform after 2015. The current usage metrics is available 48-96 hours after online publication and is updated daily on week days.
Initial download of the metrics may take a while.