Fig. 10
Download original image
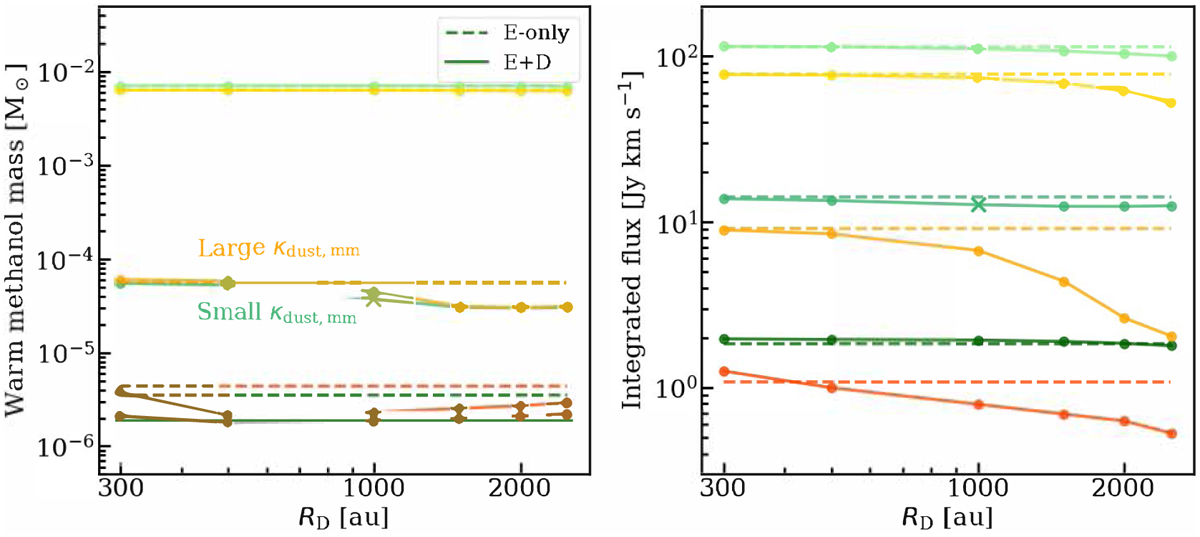
Warm methanol mass (left column) and integrated methanol emission (right column) for various disk sizes. The various shades of green and orange are used to indicate variations in luminosity. The luminosity from low to high is indicated by the darkest to lightest color. The models plotted here have luminosities 5 × 10² L⊙, 1 × 10⁴ L⊙ and 5 × 10⁶ L⊙. The dashed lines present fiducial envelope-only models with various luminosities. The solid lines present the fiducial envelope-plus-disk models with various luminosities and disk radii. The shades of orange show models with large dust grains (high mm opacity), and the shades of green show those with small grains (low mm opacity).
Current usage metrics show cumulative count of Article Views (full-text article views including HTML views, PDF and ePub downloads, according to the available data) and Abstracts Views on Vision4Press platform.
Data correspond to usage on the plateform after 2015. The current usage metrics is available 48-96 hours after online publication and is updated daily on week days.
Initial download of the metrics may take a while.