Fig. 7.
Download original image
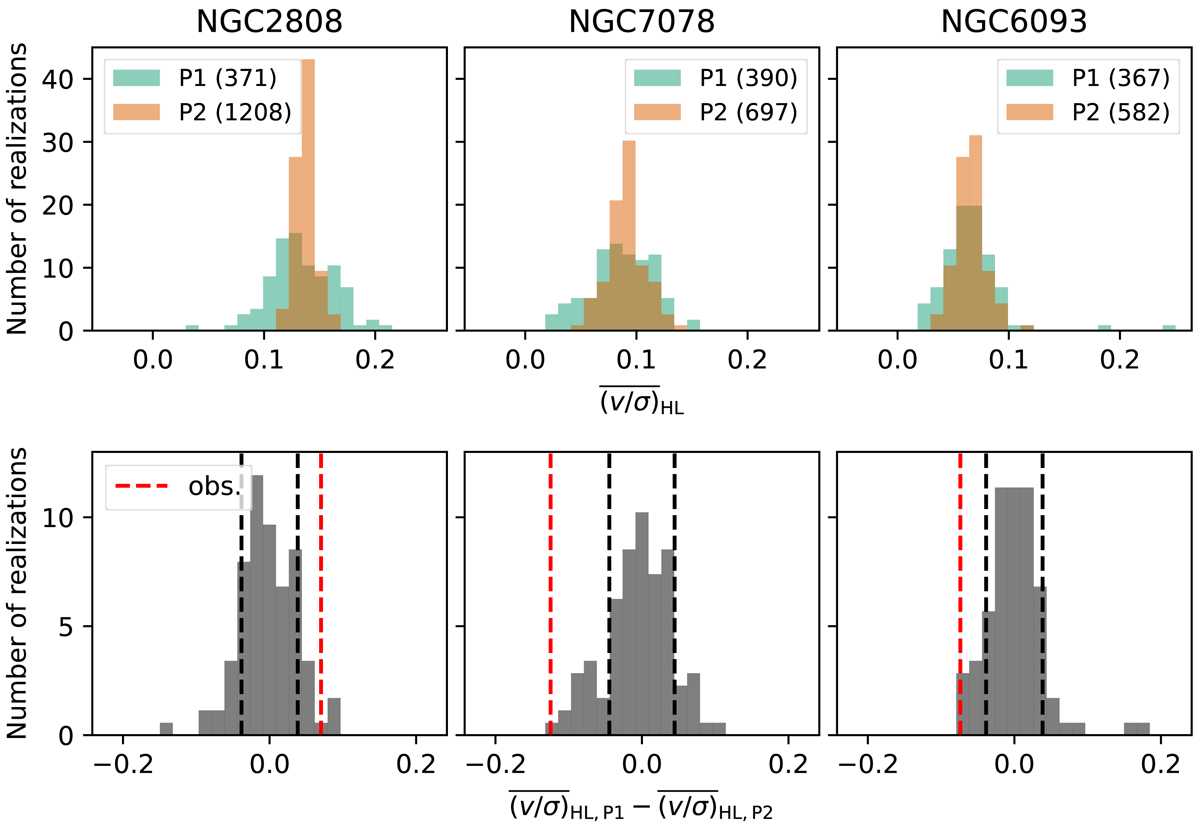
Values of ![]() for P1 and P2 derived from randomly sampling the chromosome maps of NGC 2808, NGC 6093, and NGC 7078 (top) and the corresponding differences of these values between P1 and P2 (bottom). The numbers of stars in the randomly drawn P1 and P2 are the same as the observed populations. In the bottom panel, the observed differences for these clusters are shown as the dotted red line and the standard deviation of the shown distribution as the dotted black line.
for P1 and P2 derived from randomly sampling the chromosome maps of NGC 2808, NGC 6093, and NGC 7078 (top) and the corresponding differences of these values between P1 and P2 (bottom). The numbers of stars in the randomly drawn P1 and P2 are the same as the observed populations. In the bottom panel, the observed differences for these clusters are shown as the dotted red line and the standard deviation of the shown distribution as the dotted black line.
Current usage metrics show cumulative count of Article Views (full-text article views including HTML views, PDF and ePub downloads, according to the available data) and Abstracts Views on Vision4Press platform.
Data correspond to usage on the plateform after 2015. The current usage metrics is available 48-96 hours after online publication and is updated daily on week days.
Initial download of the metrics may take a while.