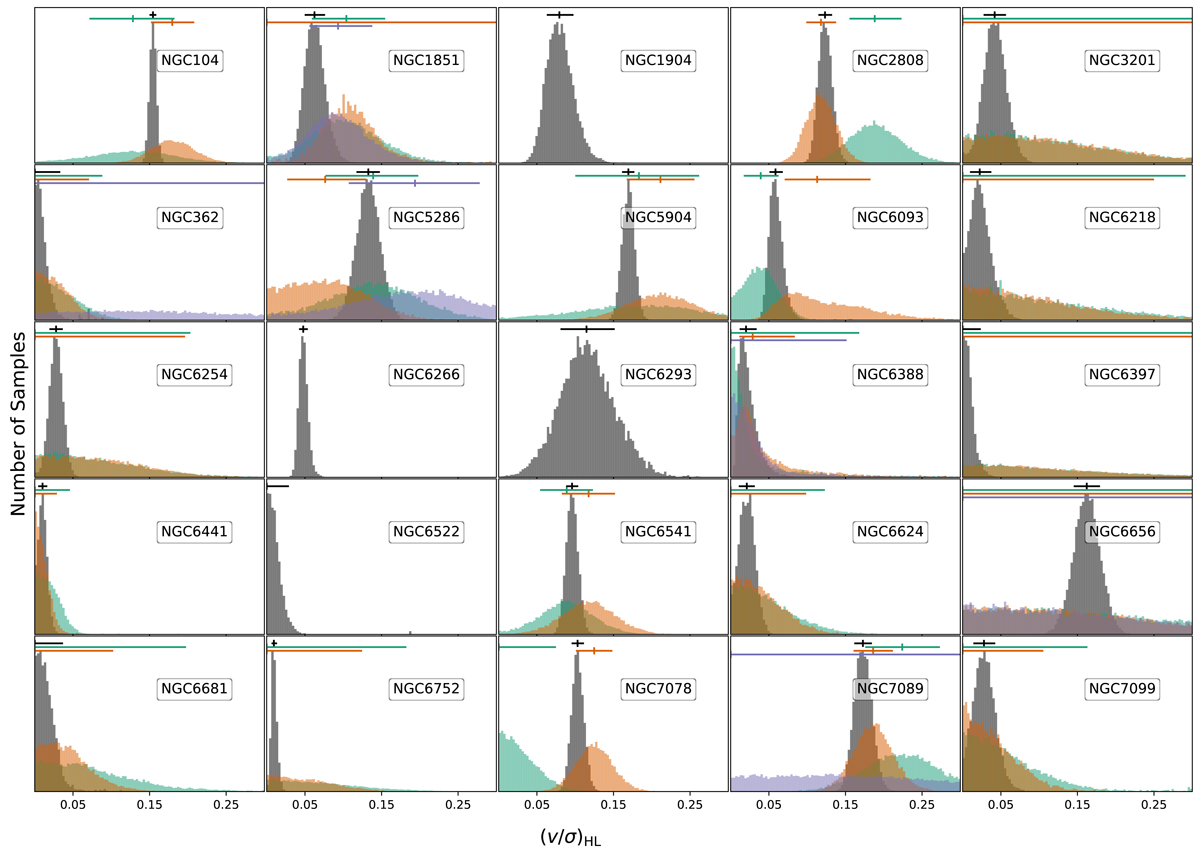
Fig. 4.
Download original image
Distributions of samples of (v/σ)HL, which describe the rotation strength for each cluster in this analysis. These distributions are shown for the overall cluster (gray) and each of its populations (P1:green, P2:orange, P3:violet). The 16th, 50th, and 84th percentile for each distribution are shown on top of the corresponding distribution. For distributions that peak at zero, only the 95th percentile is shown, to provide an upper limit on the rotation strength.
Current usage metrics show cumulative count of Article Views (full-text article views including HTML views, PDF and ePub downloads, according to the available data) and Abstracts Views on Vision4Press platform.
Data correspond to usage on the plateform after 2015. The current usage metrics is available 48-96 hours after online publication and is updated daily on week days.
Initial download of the metrics may take a while.