Fig. 2.
Download original image
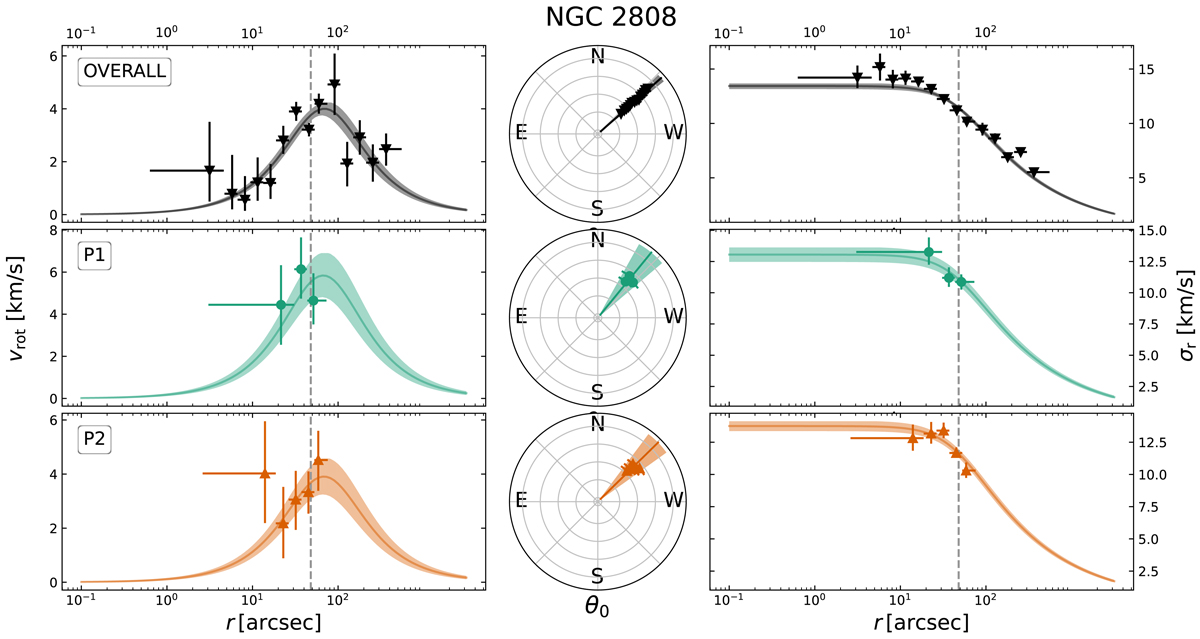
Rotation and dispersion profiles for NGC 2808 and each of its populations. The rotation profiles for each population are shown on the left and the dispersion profiles on the right. The angle of rotation is shown in the center. The continuous profiles (solid lines) and binned profiles (symbols) shown here are each determined by fitting the respective model to line-of-sight velocities of single stars. The shaded area represents the 1σ uncertainty of each continuous profile and rotation angle. The dotted vertical line in each radial profile illustrates the half-light radius of NGC 2808.
Current usage metrics show cumulative count of Article Views (full-text article views including HTML views, PDF and ePub downloads, according to the available data) and Abstracts Views on Vision4Press platform.
Data correspond to usage on the plateform after 2015. The current usage metrics is available 48-96 hours after online publication and is updated daily on week days.
Initial download of the metrics may take a while.