Open Access
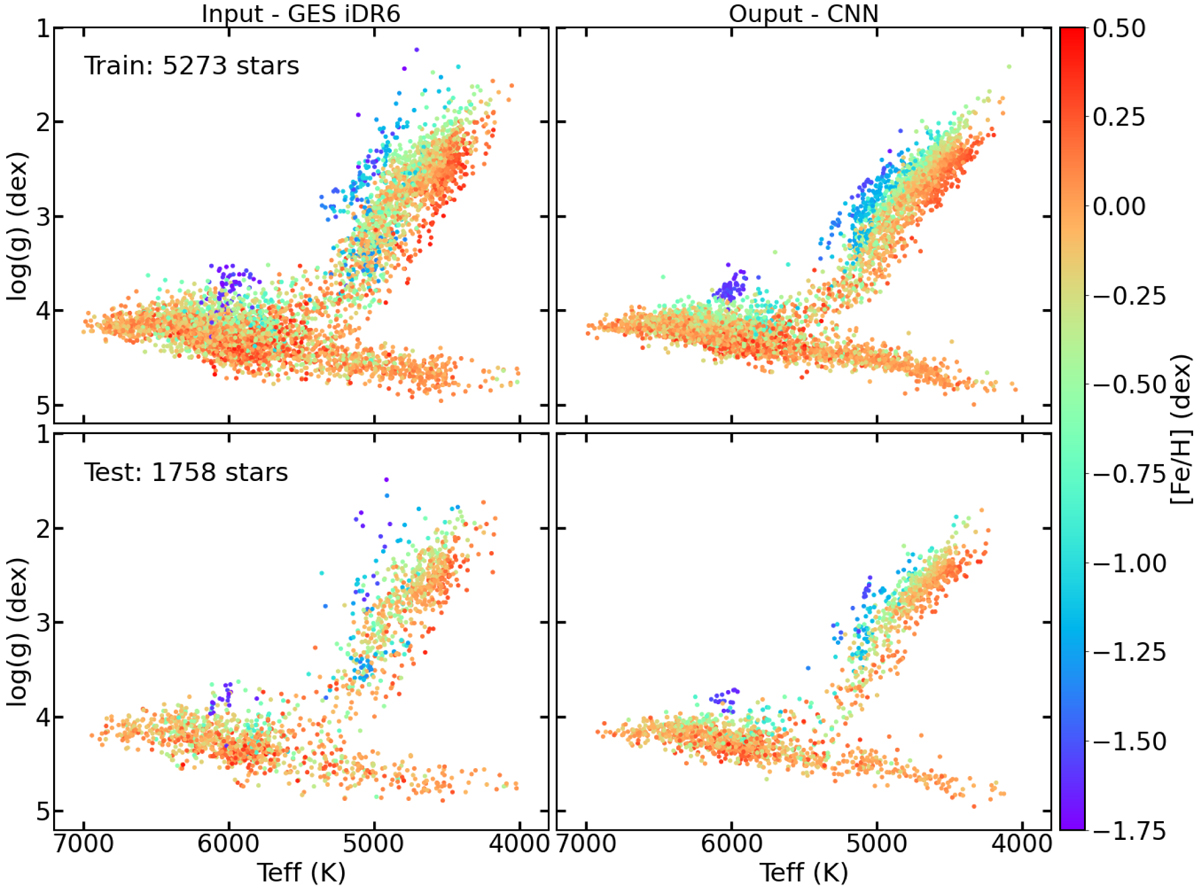
Fig. 6.
Download original image
Kiel Diagrams for the input and CNN output colored by [Fe/H]: top two panels show the train set stars using iDR6 input labels on the left and CNN output on the right. Bottom two panels show the same for the test set.
Current usage metrics show cumulative count of Article Views (full-text article views including HTML views, PDF and ePub downloads, according to the available data) and Abstracts Views on Vision4Press platform.
Data correspond to usage on the plateform after 2015. The current usage metrics is available 48-96 hours after online publication and is updated daily on week days.
Initial download of the metrics may take a while.