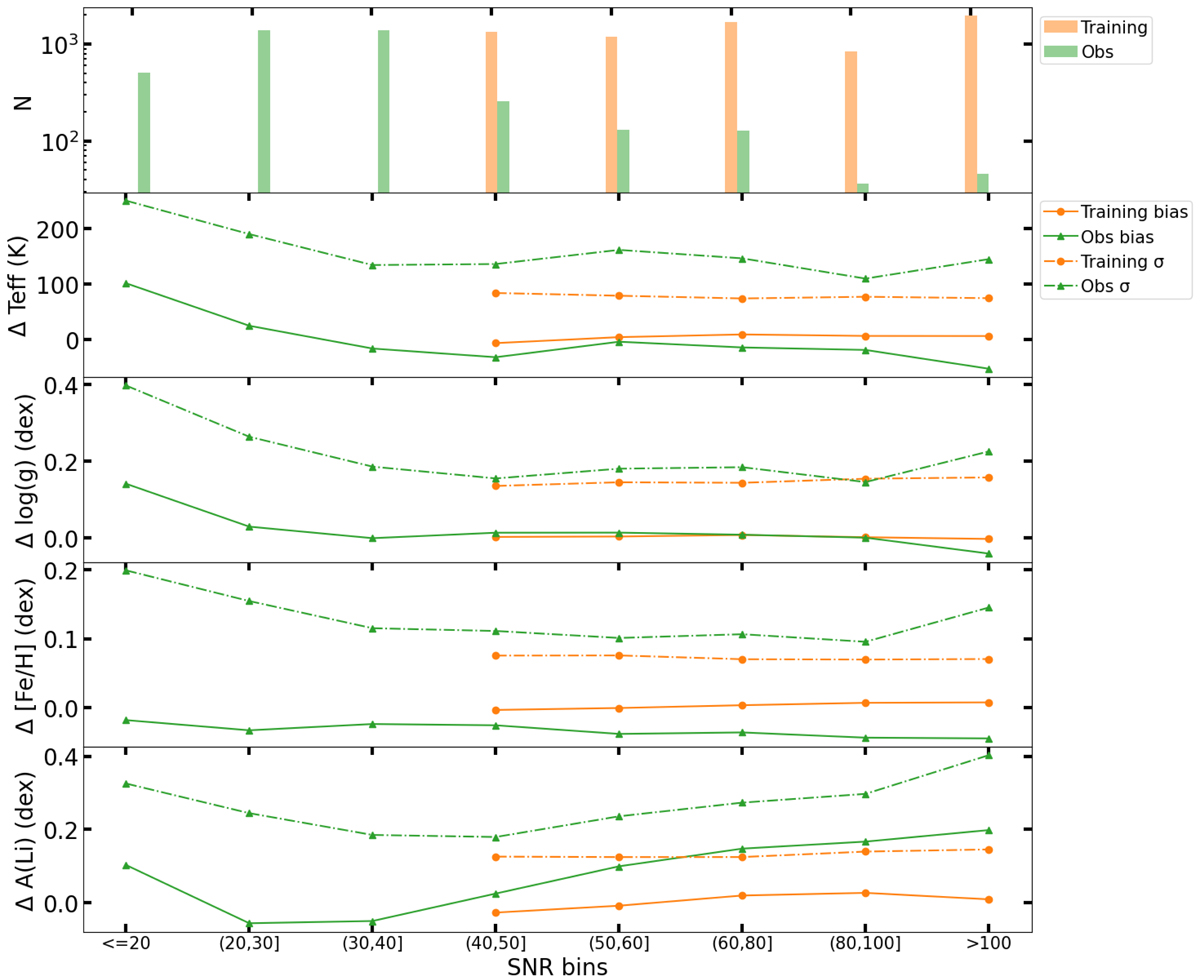
Fig. B.1.
Download original image
Histogram showing the number of spectra in each S/N bin for the training (yellow, 7031 stars) and observed (green, 5096 stars) samples (top panel). Bias (Bias = mean (CNN-iDR6), solid) and dispersion (σ = std(CNN-iDR6), dash-dot) as a function of S/N (bottom 4 panels). The observed sample is selected within training label limits, eVRAD < 1.0 km/s, with no GES flags and with UPPER_COMBINED_LI1 = 0.0. For the observed sample, we have very few stars in the two highest S/N bins in comparison to the lower S/N bins.
Current usage metrics show cumulative count of Article Views (full-text article views including HTML views, PDF and ePub downloads, according to the available data) and Abstracts Views on Vision4Press platform.
Data correspond to usage on the plateform after 2015. The current usage metrics is available 48-96 hours after online publication and is updated daily on week days.
Initial download of the metrics may take a while.