Open Access
Fig. 22.
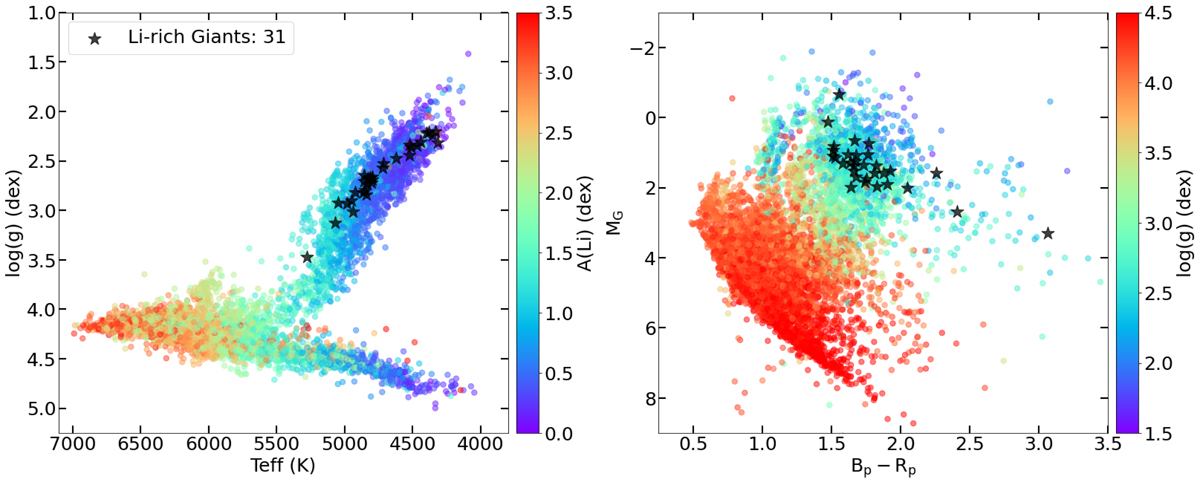
Download original image
Kiel-diagram showing the newly-discovered Li-rich giants (black stars) along with the training sample color-coded according to their Li abundance (left). Gaia color–magnitude diagram for the same stars (right). The training sample stars are colored by their surface gravities.
Current usage metrics show cumulative count of Article Views (full-text article views including HTML views, PDF and ePub downloads, according to the available data) and Abstracts Views on Vision4Press platform.
Data correspond to usage on the plateform after 2015. The current usage metrics is available 48-96 hours after online publication and is updated daily on week days.
Initial download of the metrics may take a while.