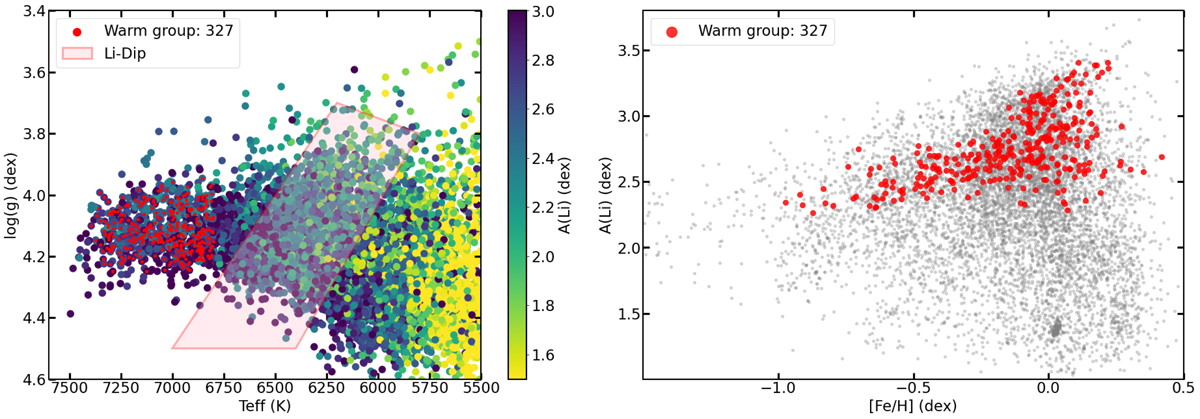
Fig. 21.
Download original image
Effective temperature vs. surface gravity diagram, with the stars color-coded according to their Li abundance (left). The approximate location of the Li-dip region according to Gao et al. (2020) is highlighted in pink. The red points represent the warm stars, Teff > 6800 and S/N > 75 pix−1. The [Fe/H] vs. Li abundance trend for the warm stars shown as red points. Gray dots represent the other stars shown in the left plot (right).
Current usage metrics show cumulative count of Article Views (full-text article views including HTML views, PDF and ePub downloads, according to the available data) and Abstracts Views on Vision4Press platform.
Data correspond to usage on the plateform after 2015. The current usage metrics is available 48-96 hours after online publication and is updated daily on week days.
Initial download of the metrics may take a while.