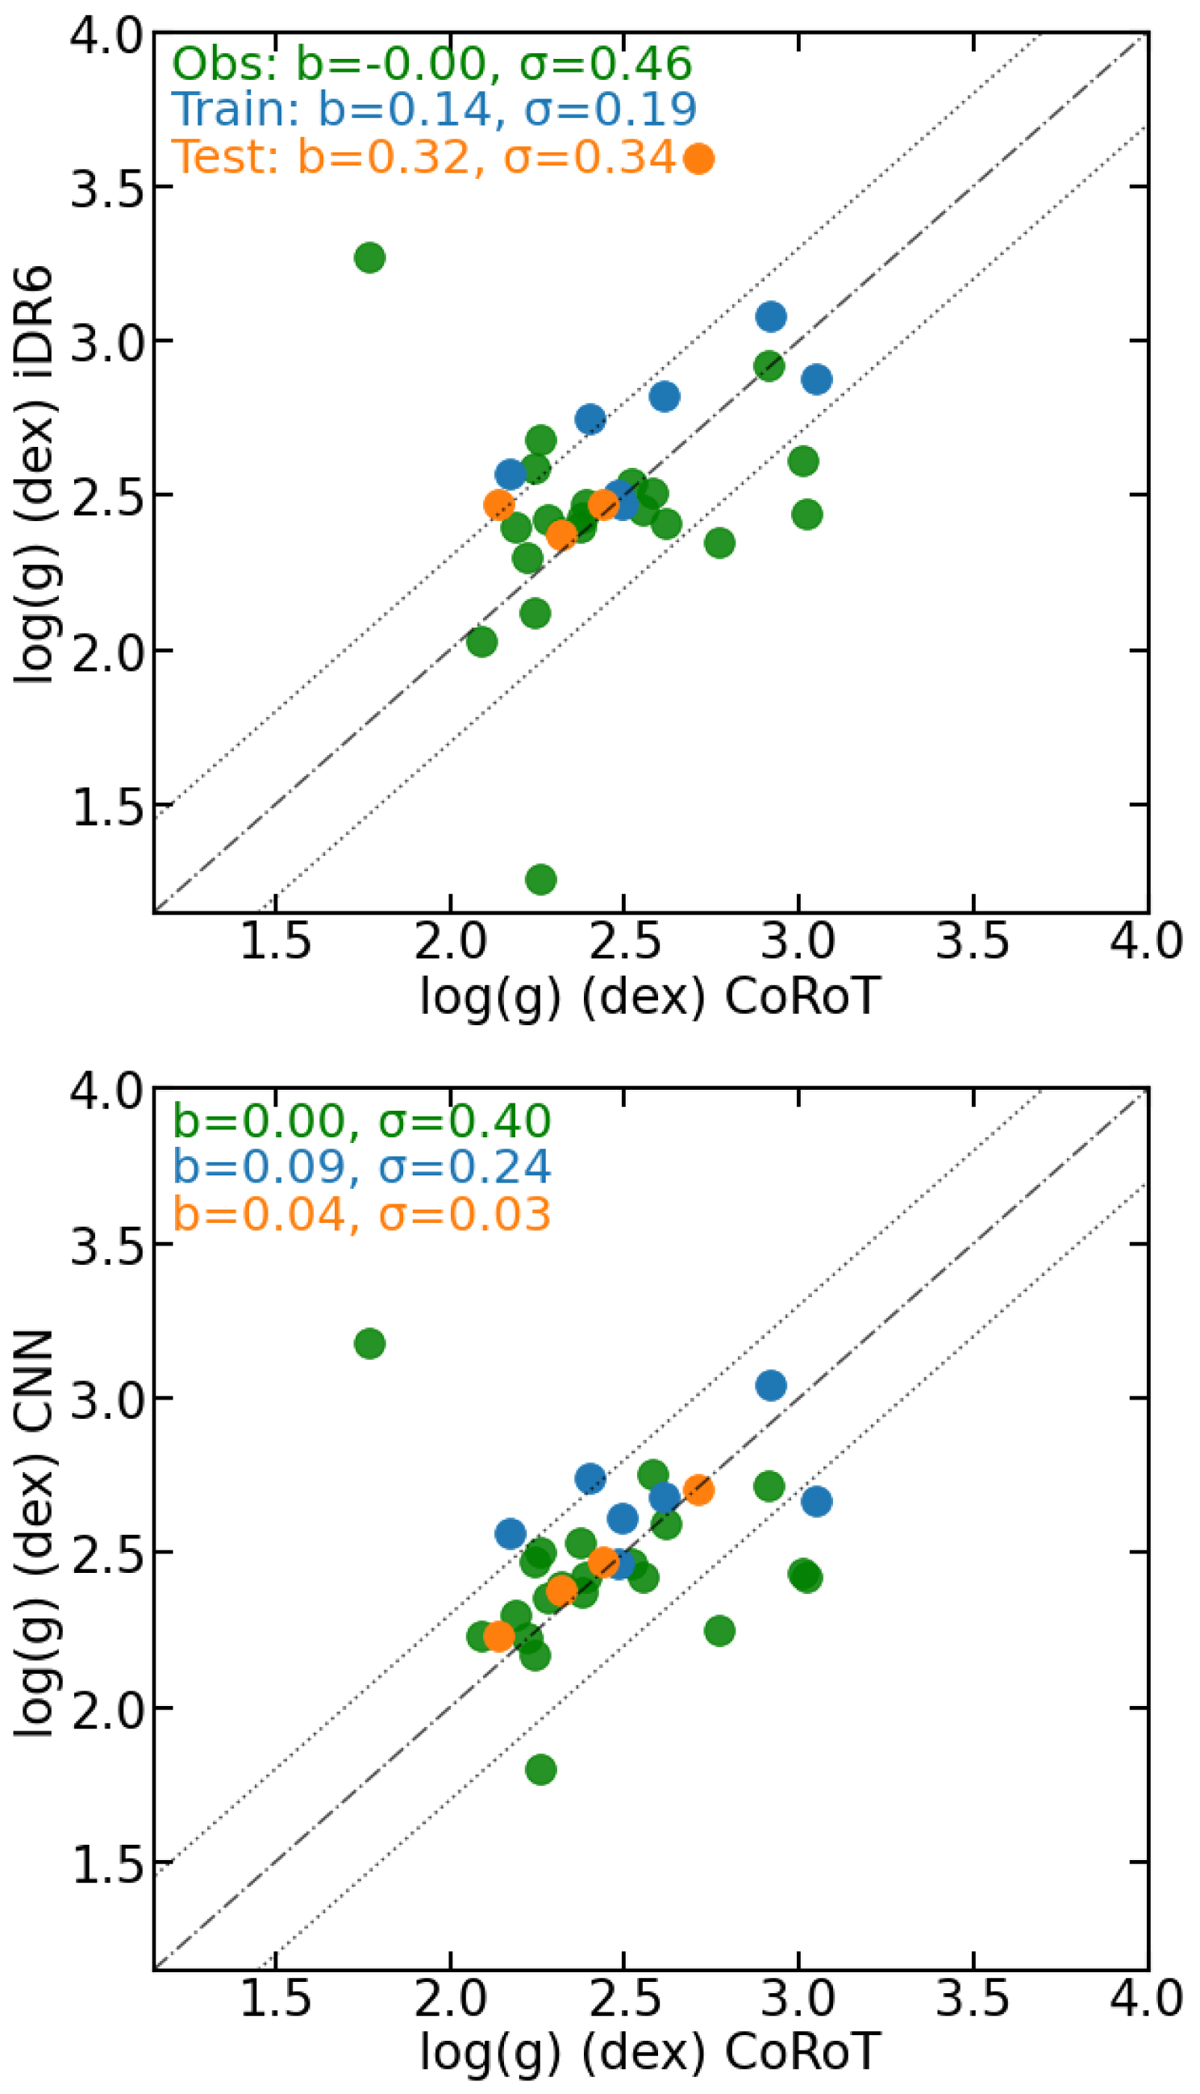
Fig. 20.
Download original image
Comparison with asteroseismic results. Left: CoRoT-GES vs. GES-iDR6 labels, Right: CoRoT-GES vs CNN predictions. Blue, orange, and green symbols represent the train, test, and observed sample selected within the training set limits (S/N > 30 pix−1, eVRAD < 0.5 km s−1, no GES flags) and with CoRoT-GES flag OFLAG_GIR = 0. The bias=mean(CNN-CoRoT) and σ = std(CNN-CoRoT) are provided. The dash-dotted line is the 1-to-1 line and the two dotted lines are at ±0.3 dex.
Current usage metrics show cumulative count of Article Views (full-text article views including HTML views, PDF and ePub downloads, according to the available data) and Abstracts Views on Vision4Press platform.
Data correspond to usage on the plateform after 2015. The current usage metrics is available 48-96 hours after online publication and is updated daily on week days.
Initial download of the metrics may take a while.