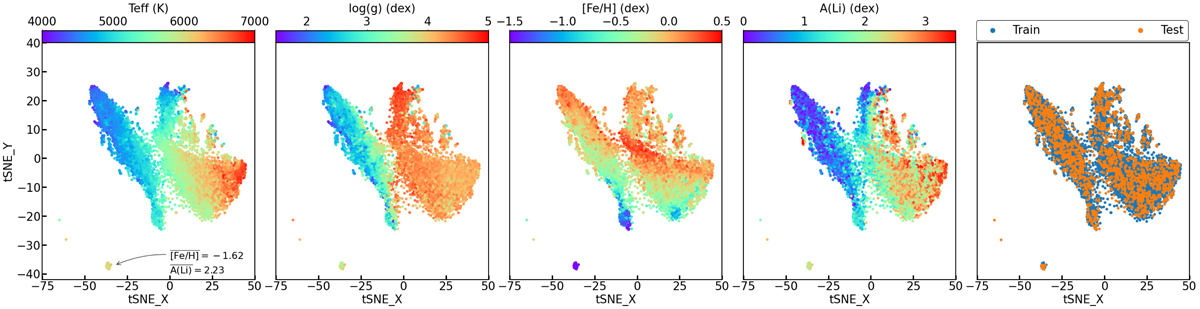
Fig. 2.
Download original image
2D projection of t-SNE output for the 7031 spectra of the training sample, colored by the labels Teff, log(g), [Fe/H] and A(Li) respectively. The right-most plot shows the t-SNE as the train and test sets to highlight their similar distribution across the label range. In the left subplot, we show the mean [Fe/H] and A(Li) for the highlighted island that consists of Spite plateau-like stars in the globular cluster NGC 6752.
Current usage metrics show cumulative count of Article Views (full-text article views including HTML views, PDF and ePub downloads, according to the available data) and Abstracts Views on Vision4Press platform.
Data correspond to usage on the plateform after 2015. The current usage metrics is available 48-96 hours after online publication and is updated daily on week days.
Initial download of the metrics may take a while.